Education
Education is an important source of knowledge for people to understand the world around them and improve their life situation. Developing knowledge and skills can be regarded both as a goal in its own right and as a key means to achieve important goals in other areas, such as employment, self-sufficiency and the levelling of inequalities in living conditions. In an employment market with a high demand for qualified labour, completed upper secondary education outweighs an immigrant background. The relatively large proportion of the immigrants in Norway who only have primary and lower secondary school is a main reason for the inequalities in employment (Olsen, 2020). There is also higher employment among people who have took their education in Norway than people with education from another country. This applies regardless of level of education, but the difference is greatest for refugees who have taken higher education (Official Norwegian Report – NOU, 2021:2).
Education and qualification are therefore a key to integration and constitute the first of four priority areas in the government’s integration strategy (Ministry of Education and Research, 2018). It is decisive for their integration that children and young people with an immigrant background do not lag far behind in the school system, and that adult immigrants who need it have the opportunity to develop skills in line with the labour market needs
Kindergarten attendance is increasing most among the youngest children
Kindergarten attendance has a positive impact on minority language children’s language development and integration. A number of Norwegian studies have found positive effects of kindergarten attendance and schemes such as “early start” and “free core hours” (e.g. Drange (2016, 2018); Drange and Havnes (2015); Bråten et al. (2014)).
Figure 2.1: Kindergarten attendance, children aged 1–5 years, broken down by language background (IMDi, 2019a)
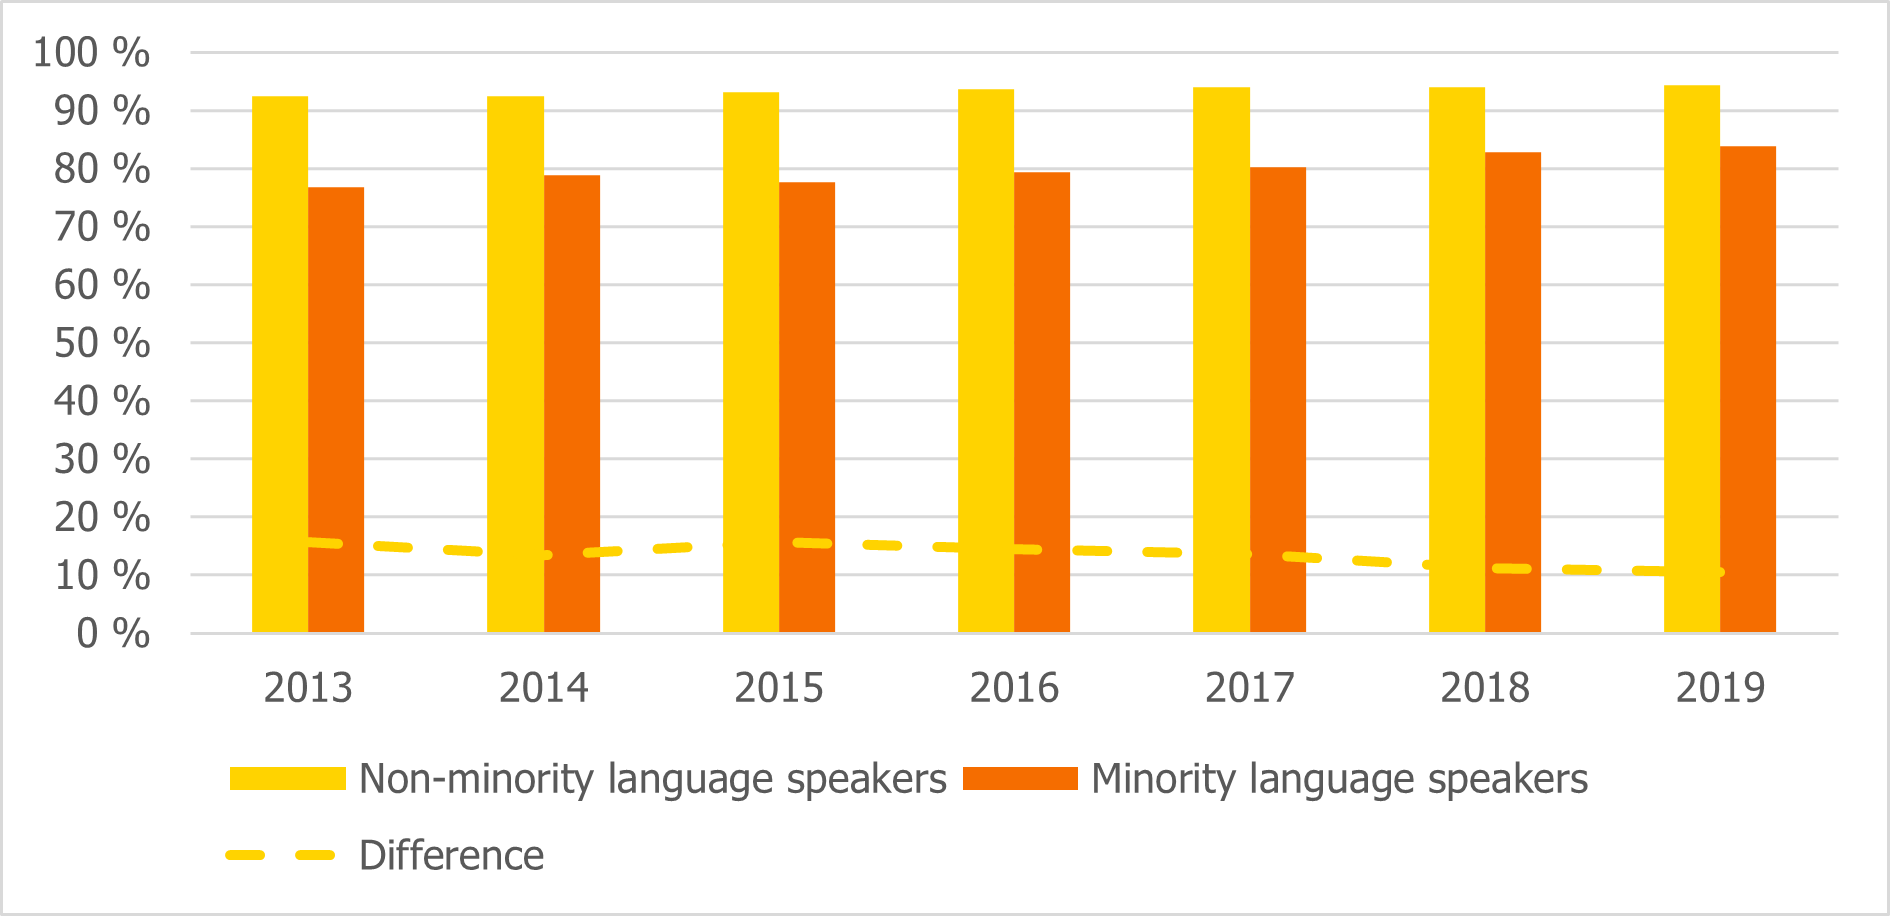
The proportion of minority language children aged 1–5 years attending kindergarten has increased from 77 per cent to 84 per cent in the period 2013–2019. This share is still lower than among non-minority language speakers of the same age, but the difference between these two groups has decreased since 2013 (IMDi, 2019a).
The differences in kindergarten attendance are greatest among the youngest children and smallest among the oldest. There is significantly lower kindergarten attendance among minority language one and two-year-olds. The differences are much smaller for children aged 3–5 years. At the same time, the largest increase in the proportion of children who attended kindergarten in the years 2013–2019 was observed among the youngest children. For minority language one year-olds, this proportion has grown by 13 per cent during this period, totalling 53 per cent in 2019. By contrast, four-fifths of non-minority language one year-olds were in kindergarten.
Stable differences in primary and lower secondary school results
School results from compulsory primary and lower secondary schooling (measured in “school points”) is used as an indicator of results achieved from primary and secondary education and formal qualification to upper secondary school. In addition, the level of grades from primary and lower secondary school is the single factor that has the greatest significance for completion of upper secondary education or training.
There are systematic differences in average grade from compulsory primary and lower secondary education measured in school points according to sex and immigrant background. On average, immigrants have lower grades on completion of compulsory primary and lower secondary schooling than the rest of the population. In 2020, this difference was around 5 school points, which corresponds to half a grade. People born in Norway to immigrant parents had an average grade from compulsory primary and lower secondary education that is two school points lower than the rest of the population.
Figure 2.2: Grade from compulsory primary and lower secondary education, broken down by sex and immigrant category (Statistics Norway – SSB, 2020g)
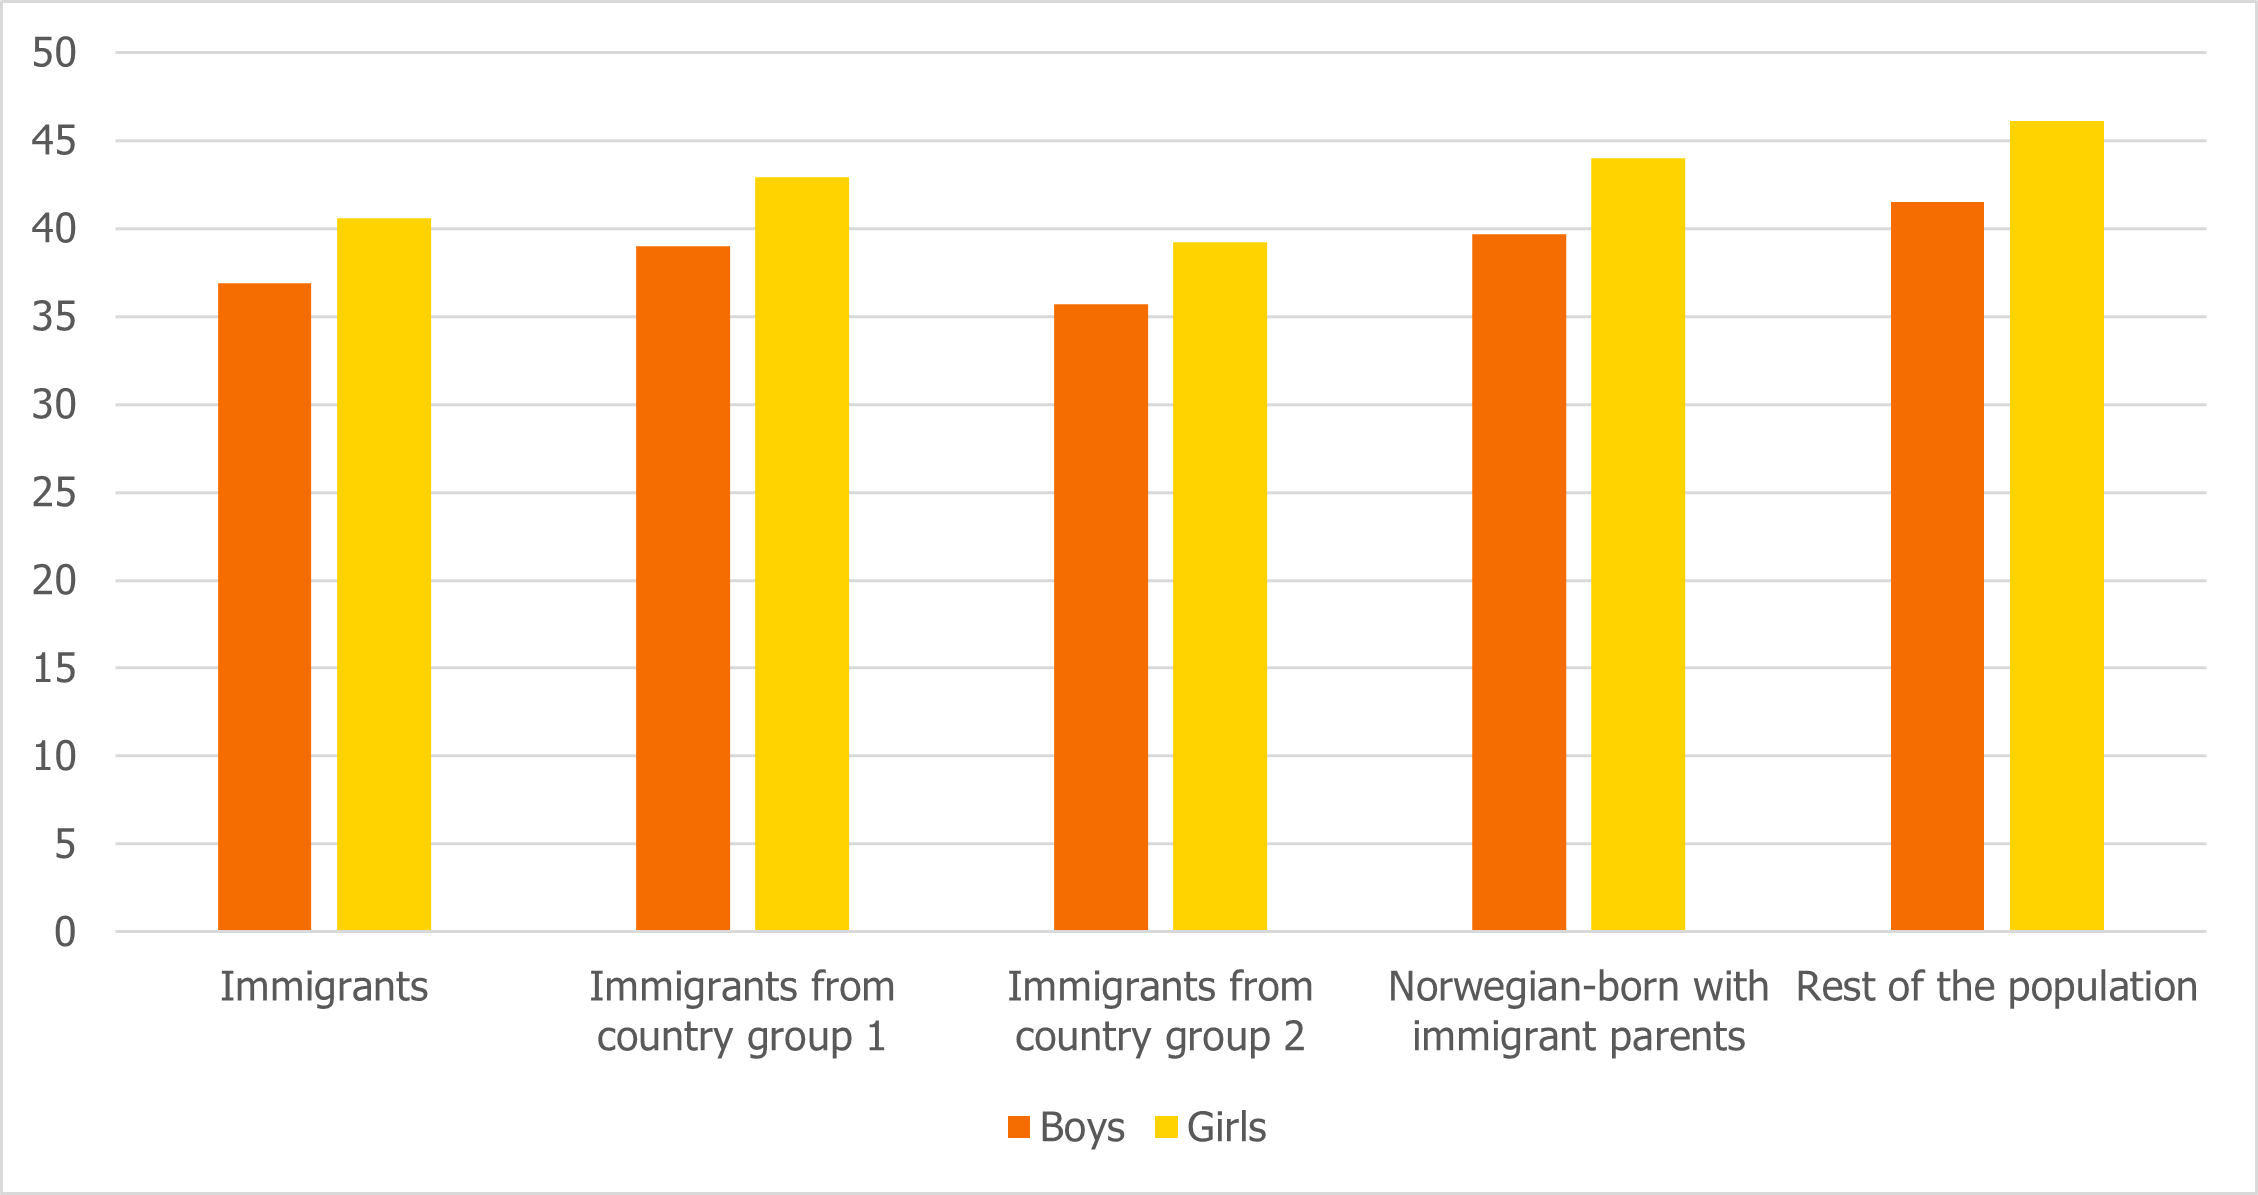
Figure 2.2 also shows that the results vary somewhat according to sex and national background.
Immigrants from country group 1 had an average that is 3.5 school points higher than immigrants from country group 2. Girls achieve higher grades than boys regardless of immigrant category, also when divided into two country background groups. level of grades from primary and lower secondary education has risen over time for all the groups described above, and the differences we see in 2020 have remained virtually unchanged since 2009.
Highest upper secondary education completion rate among girls born in Norway to immigrant parents
Figure 2.3: Proportion of people aged 16–24 years who have completed upper secondary education or training within five years. (IMDi, 2019c)
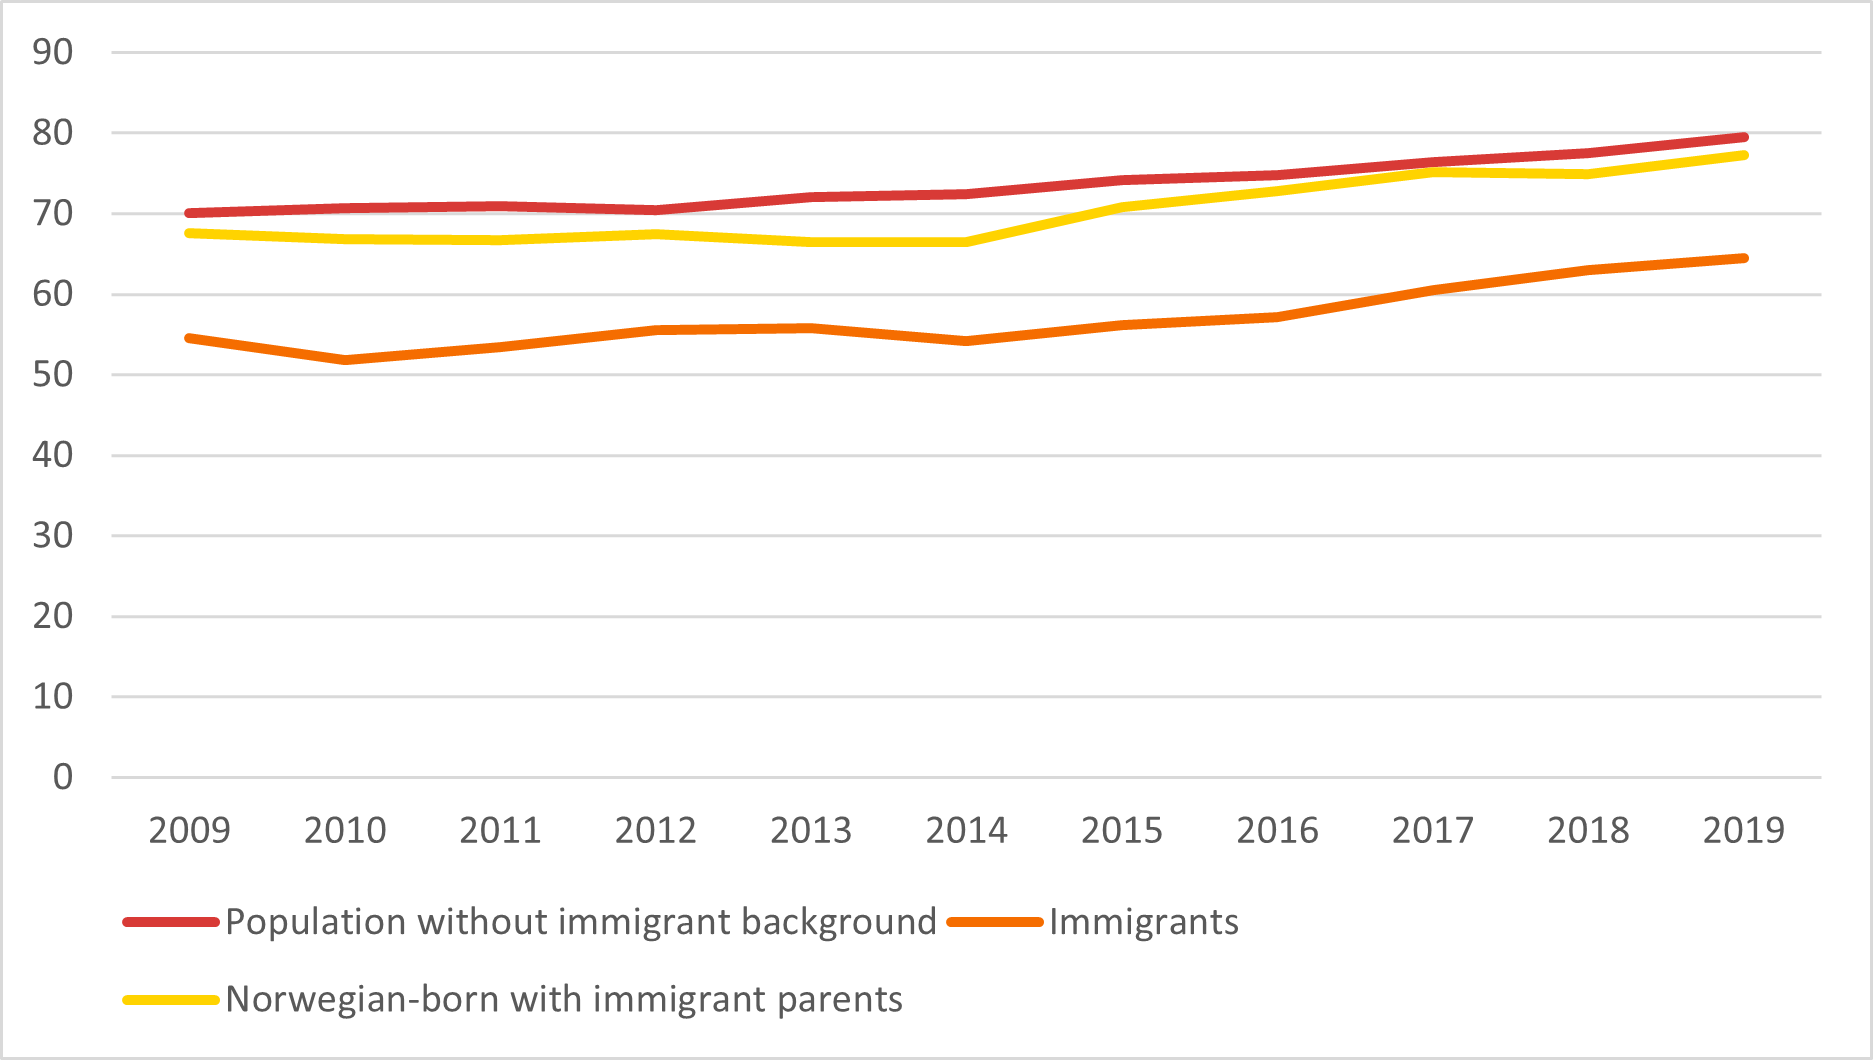
The proportion of people who complete upper secondary education or training within five years has risen in the period 2014–2019 among immigrants, their descendants and the rest of the population. Among immigrants, this proportion has been at a lower level, and was at 65 per cent in 2019. The share among people born in Norway to immigrant parents was significantly higher (77 per cent), which is almost on par with the rest of the population (80 per cent).
Among all immigrant categories, the completion rate is generally higher among women than men, with the lowest completion rate among young immigrant men. In 2019, 58 per cent of male immigrants aged 16–24 completed upper secondary education or training within five years. The corresponding share among men in the rest of the population was 75 per cent.
Figure 2.4: Proportion of people aged 16–24 years who completed upper secondary education or training within five years, broken down by sex and immigrant category. 2019 (IMDi, 2019d)
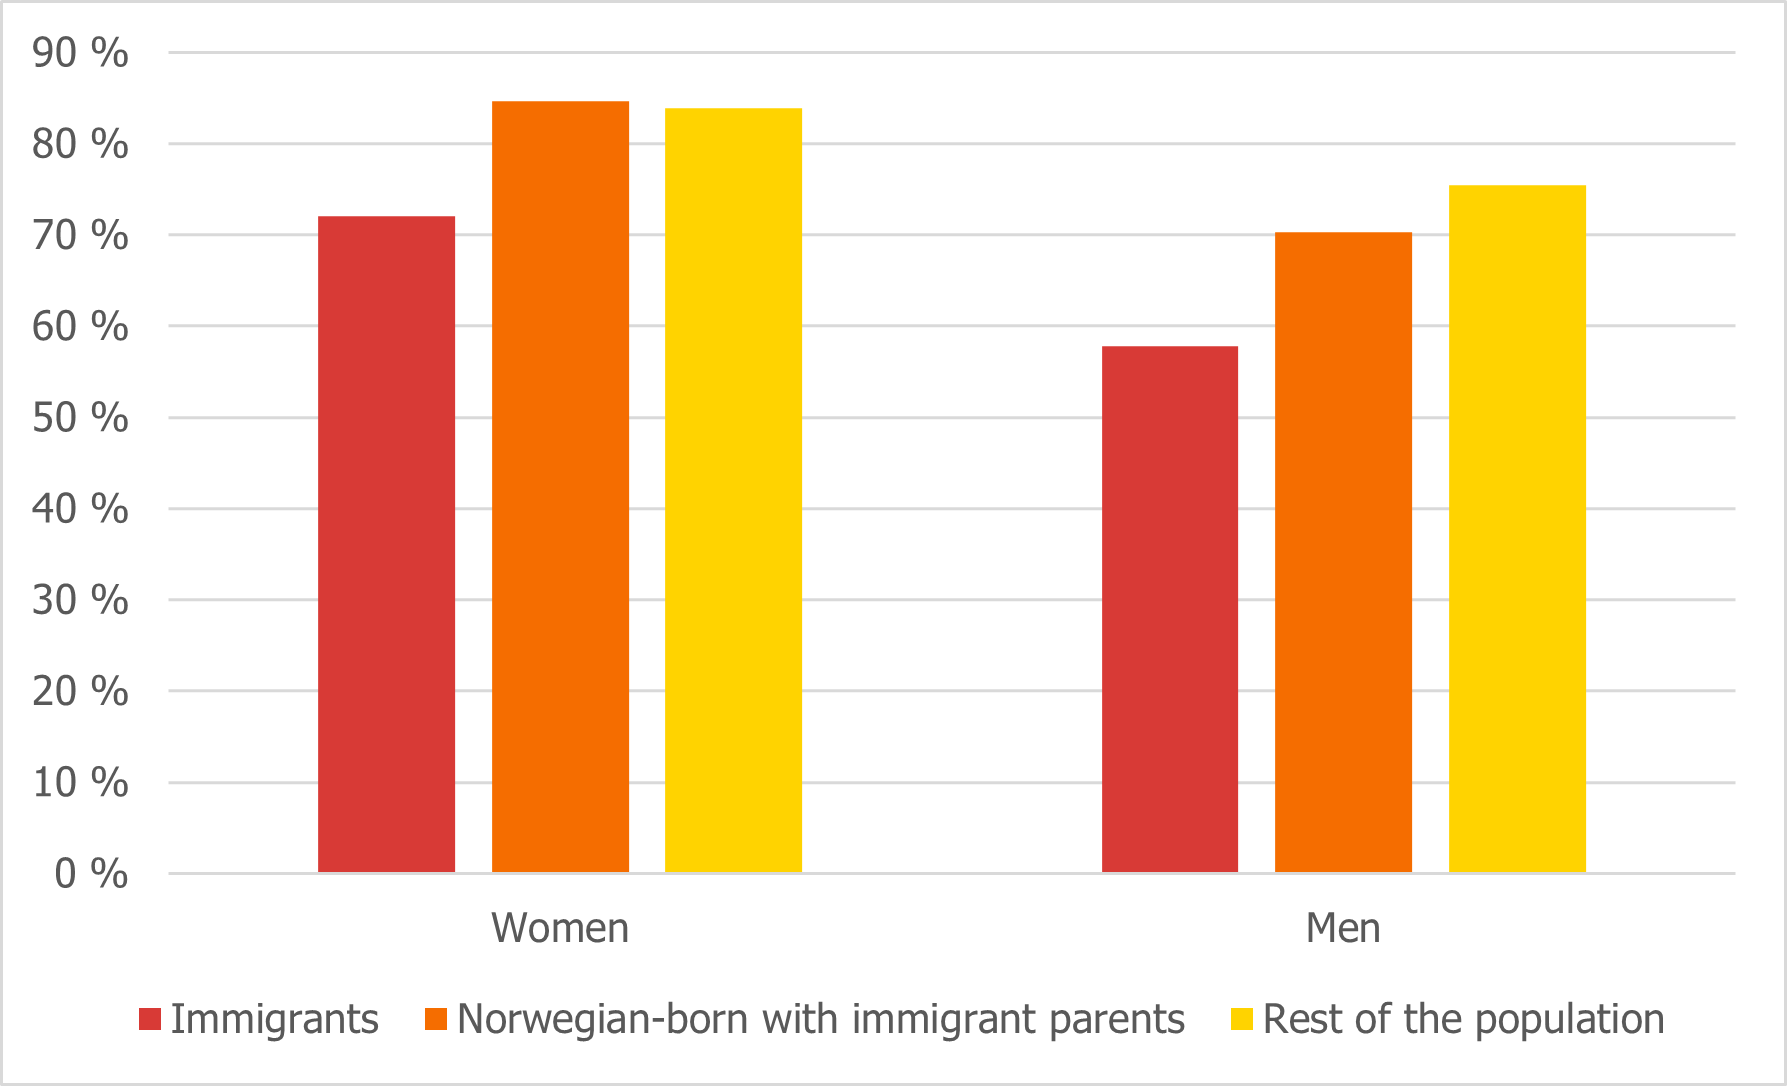
Figure 2.4 illustrates the differences in the completion rates for men and women in different immigrant categories in 2019. Since 2014, the completion rate among immigrant men and women has risen more sharply than for the rest of the population. This has contributed to a smaller difference in the proportion of people who complete upper secondary schooling between immigrants and the rest of the population.
In addition to sex, the completion rate also varies with other factors, such as socioeconomic background, grades from primary and lower secondary school, and type of programme embarked upon.
There is a large difference in the completion rate between pupils who embark upon a vocational programme and pupils who embark upon general studies programmes. This difference is found regardless of whether they have an immigrant background or not. In 2019, the proportion of immigrants who completed a vocational programme was 57 per cent, while around three-quarters completed a general studies programme.
Figure 2.5: Upper secondary education completion rate, broken down by immigrant category and type of educational programme (Statistics Norway – SSB, 2019c)
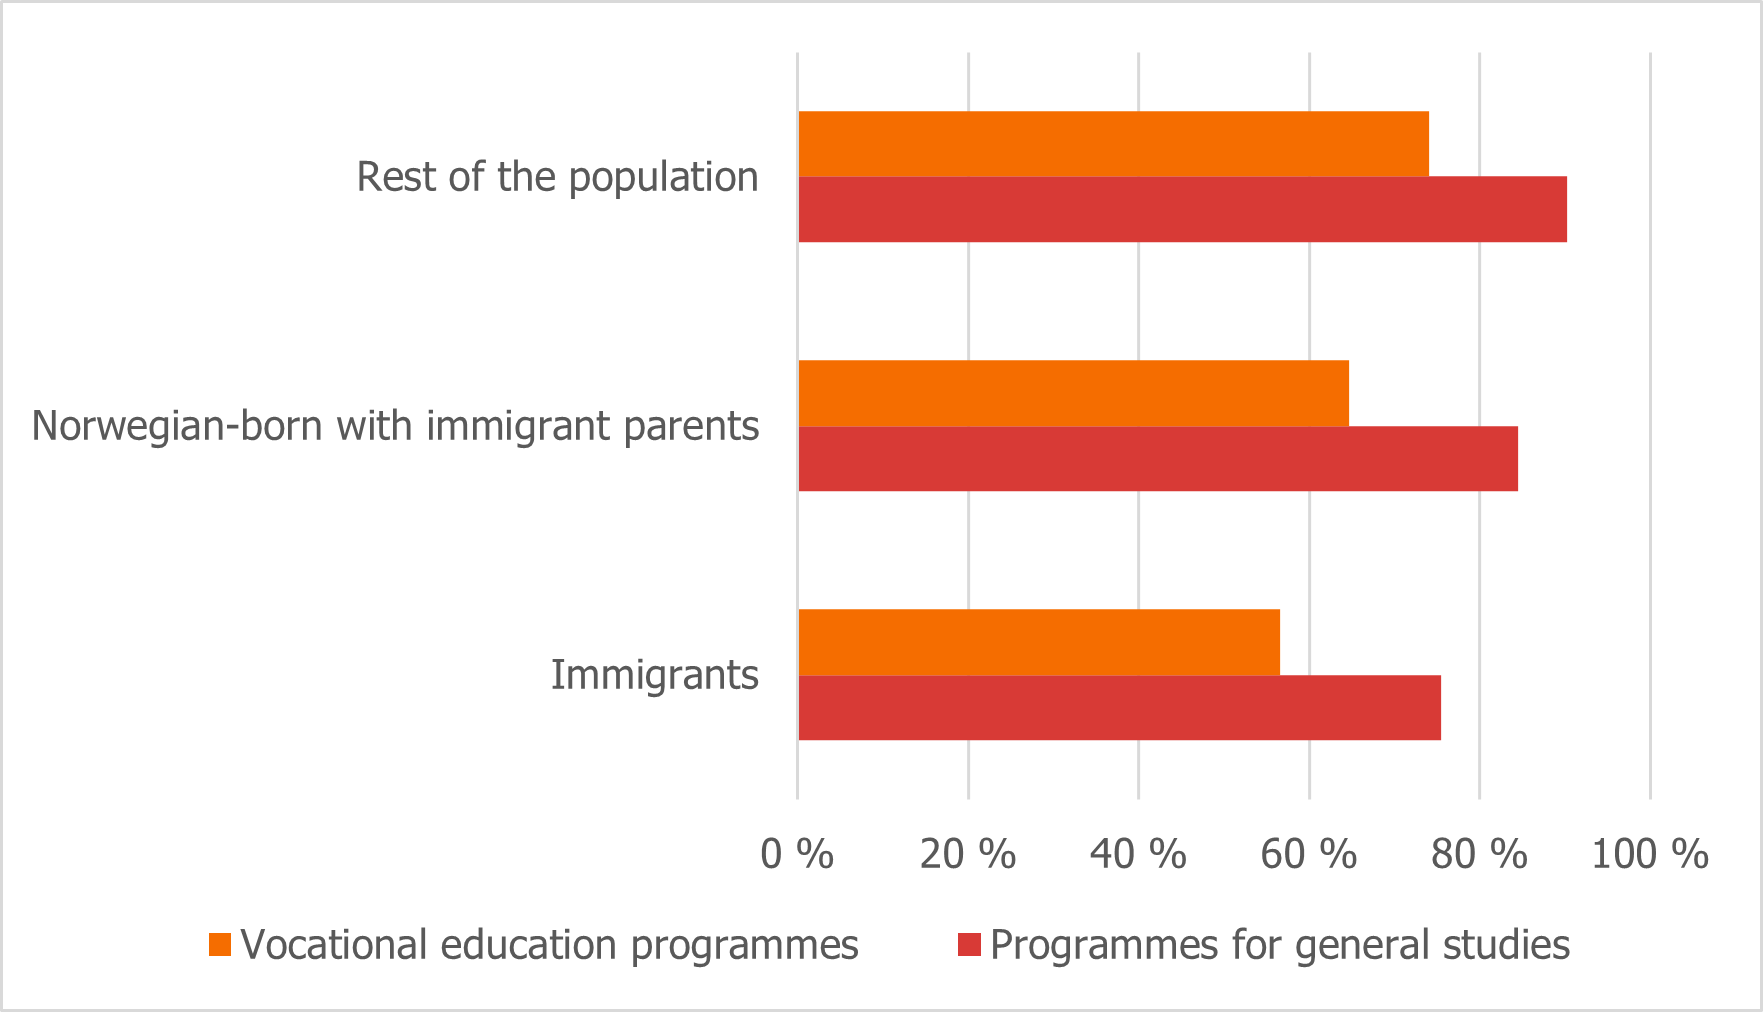
In the rest of the population, the completion rate was 74 per cent for vocational programmes and 90 per cent for general studies programmes. Among people born in Norway to immigrant parents, the completion rate in both categories of educational programme was virtually the same as for the rest of the population (Figure 2.5).
More young people taking higher education
The proportion of people aged 19–34 years who take higher education has increased steadily since 2009, both among young people with an immigrant background and in the rest of the population. People born in Norway to immigrant parents stand out by the fact that a third of people in the age group 19–34 years were in higher education in 2020. The corresponding share was 11 per cent for immigrants and 23 per cent for the rest of the population. This proportion was highest among women in all the groups. In 2020, 37 per cent of Norwegian-born women with immigrant parents were students.
Figure 2.6: Students aged 19–34 years in higher education as a percentage of the registered cohort, broken down by immigrant category. 2009–2020 (Statistics Norway – SSB, 2020h)
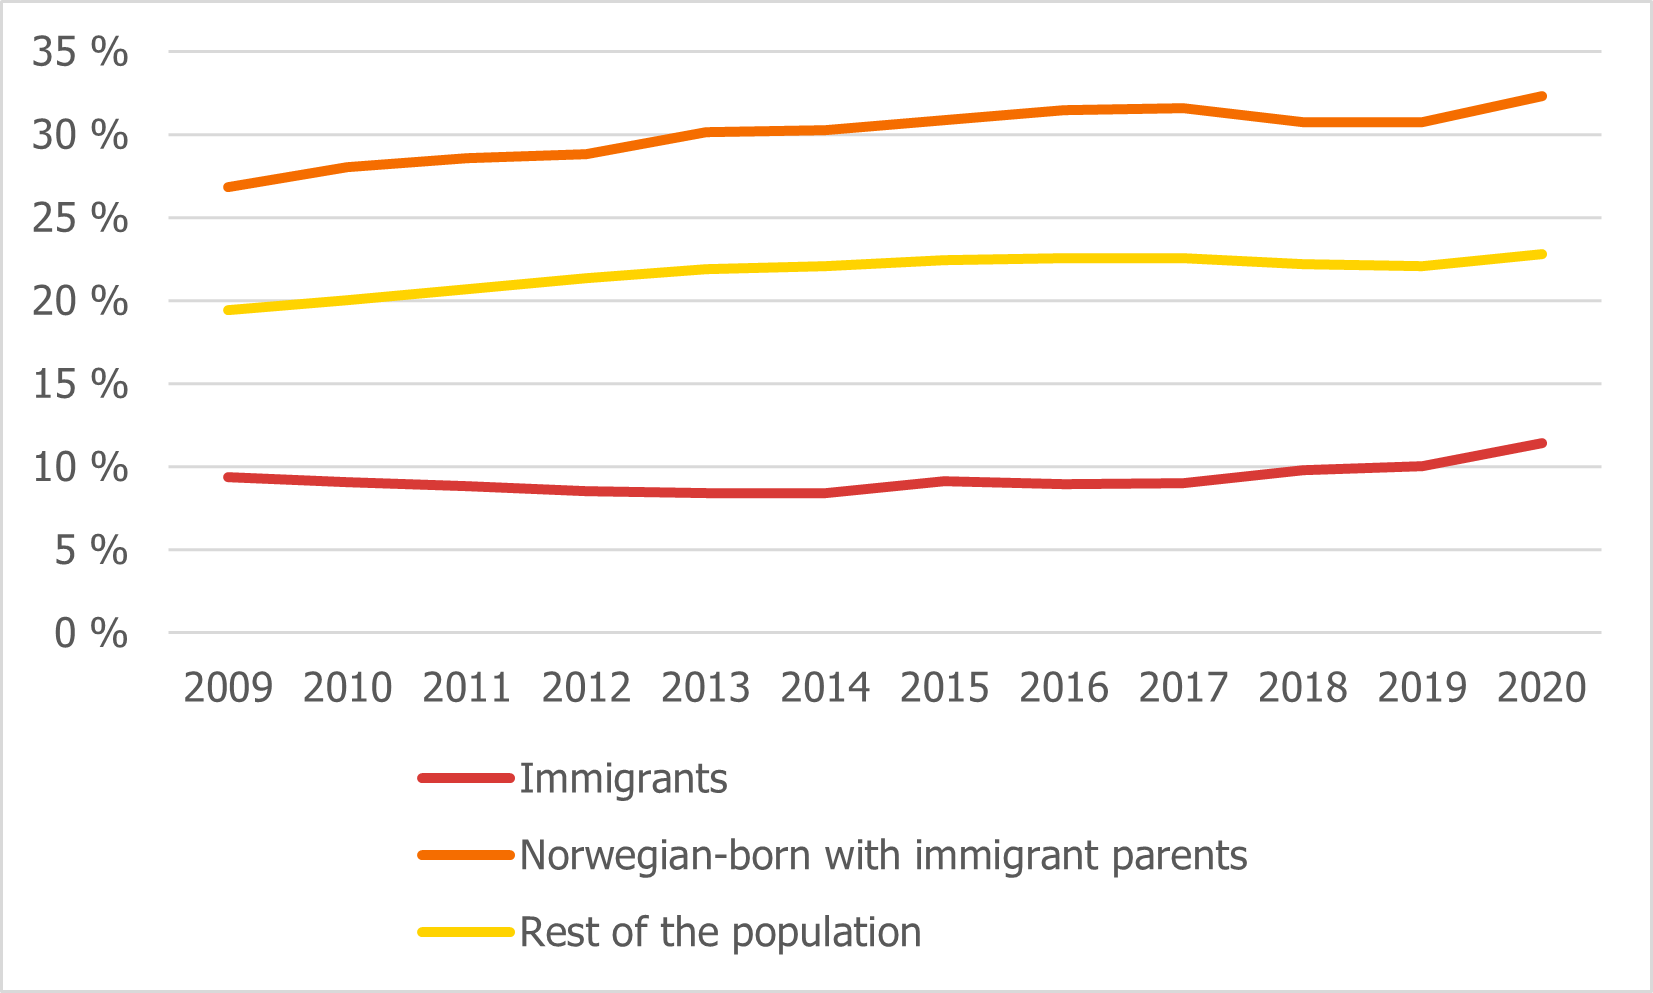
The Institute for Social Research describes the educational pattern among people born in Norway to immigrant parents as polarised. They are overrepresented in both the group that take higher education and in the group that has not completed upper secondary education or training (Institute for Social Research – ISF, 2019). Furthermore, there are major differences among people born in Norway to immigrant parents based on their parents’ national background. This applies to both commenced and completed higher education. There is a clear tendency for people born in Norway to immigrant parents from India, Sri Lanka and Vietnam in particular to take higher education (Kirkeberg et al., 2019).
Qualifications for lasting participation in the labour market
The main objective of Norway’s integration policy is to ensure that immigrants participate to a greater extent in the labour market and society as a whole. To achieve this, it is crucial that newly arrived immigrants and refugees are offered the opportunity to take and complete qualifications that can help ensure lasting participation in the labour market. The qualification schemes are intended to bridge the gap between the competencies the individual has from before and the needs in the Norwegian labour market.
Recently arrived refugees and their reunified family members that join them in Norway participate in the introduction programme and training in Norwegian and social studies. This section of the report describes participation in these two qualification programmes and the results achieved. There are also a number of other schemes that provide qualifications intended to increase participation in the labour market and society as a whole: training for asylum seekers in reception centres, the “Jobbsjansen” [“job opportunity”] scheme, and adapted vocational education and training.
These are described in more detail in the Directorate of Integration and Diversity (IMDi)’s annual report (IMDi, 2020).
The target group for the introduction programme is refugees aged 18–55 years and their reunified family members who have been granted a residence permit in Norway. In 2017, there were a record number of participants – almost 29,000 people. Since then, the number has decreased, amounting to approximately 21,000 in 2019 (IMDi, 2020d).
The national goal is that 70 per cent of the people who take this programme will be in work or education one year after completing the programme. Among the participants who completed the introduction programme in 2018, 66 per cent were in work or education in 2019. At the same time, there is considerable variation in this proportion when broken down by sex and age. For example, of the 2018 cohort, 73 per cent of the men and 48 per cent of the women were in work or education in 2019. Among men, the share transitioning to work or education has increased by 7 percentage points in the years 2015–2019, while for women this share has remained relatively stable in the same period.
Figure 2.7: Proportion in employment or education one year after completing the introduction programme, broken down by sex and age. 2018 (Statistics Norway – SSB, 2018)
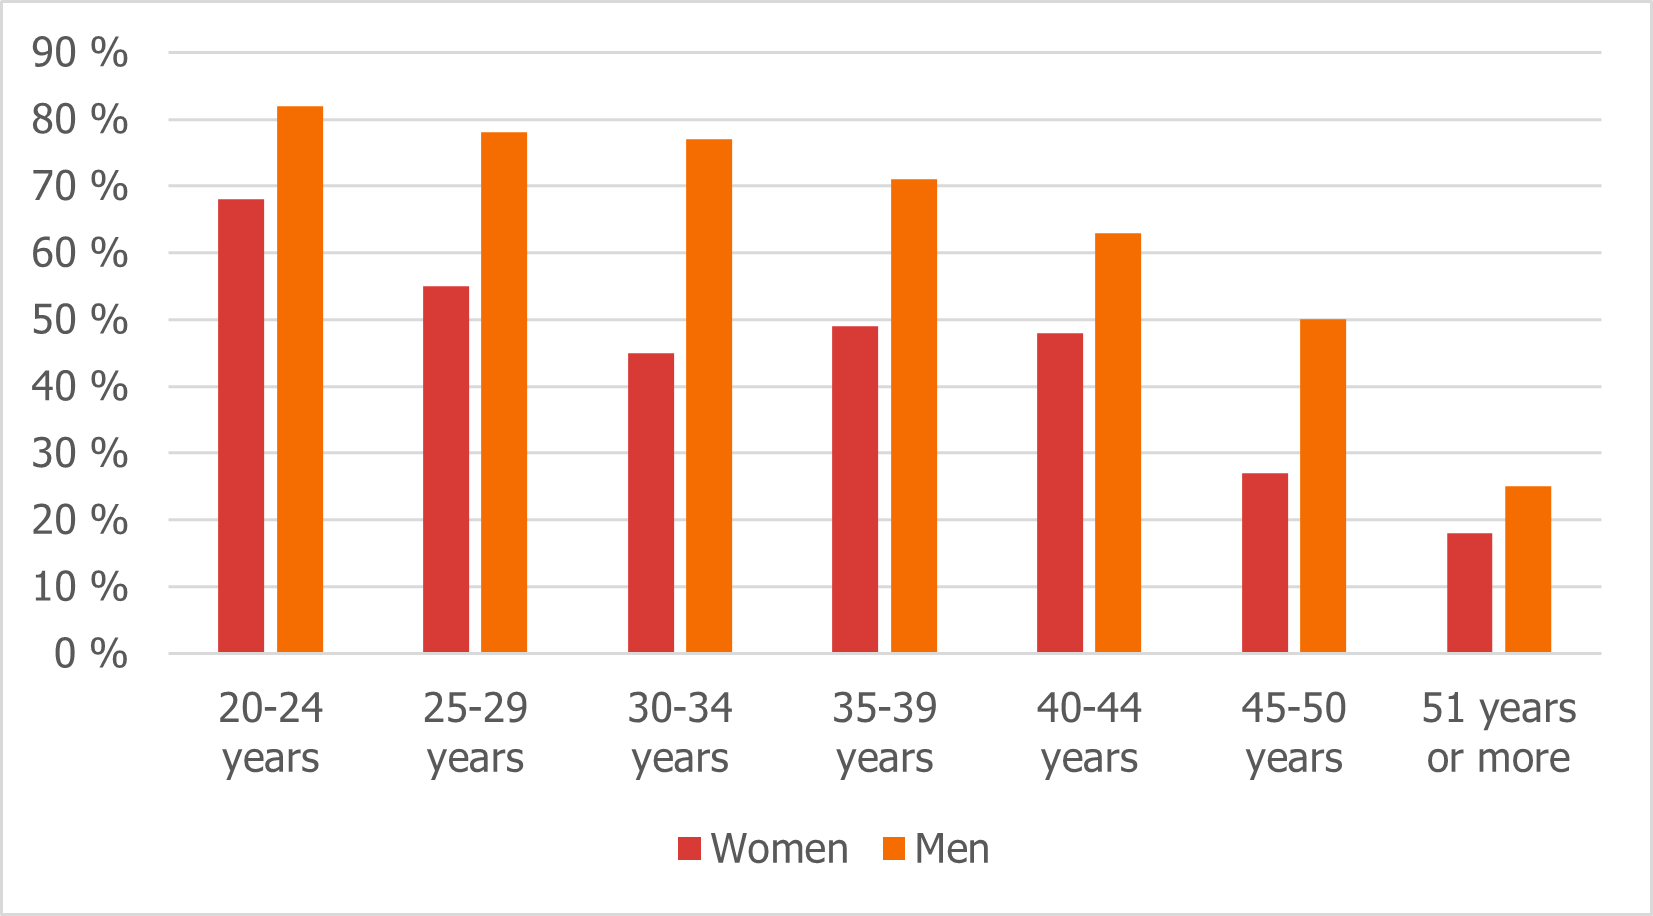
As Figure 2.7 shows, the proportion who made the transition to work or education was highest among the youngest participants (20–24 years), and largely decreases with age.
Extensive changes have been made to the introduction programme for participants starting from 1 January 2021, as a result of the new Integration Act. The impact of these statutory amendments will be seen in the coming years, when these individuals’ participation in the labour market is measured over time.
As part of the introduction programme, the participants receive instruction in the Norwegian language and social studies. However, the target group for training in Norwegian and social studies is much broader. For example, immigrants aged 16 to 67 years (18 to 67 from 2021) with a residence permit that provides grounds for a permanent residence permit (settlement permit) have a right and obligation to participate in Norwegian language training and social studies. As was the case for the introduction programme, there have been fewer participants in recent years. In 2019, a total of 31,000 people underwent training in Norwegian and social studies (the Norwegian Institute for Adult Learning – Kompetanse Norge, 2019).
Figure 2.8: Norwegian language test results, broken down by type of test. Number of Norwegian language test results, broken down by type of test. Number (the Norwegian Institute for Adult Learning – Kompetanse Norge, 2019)
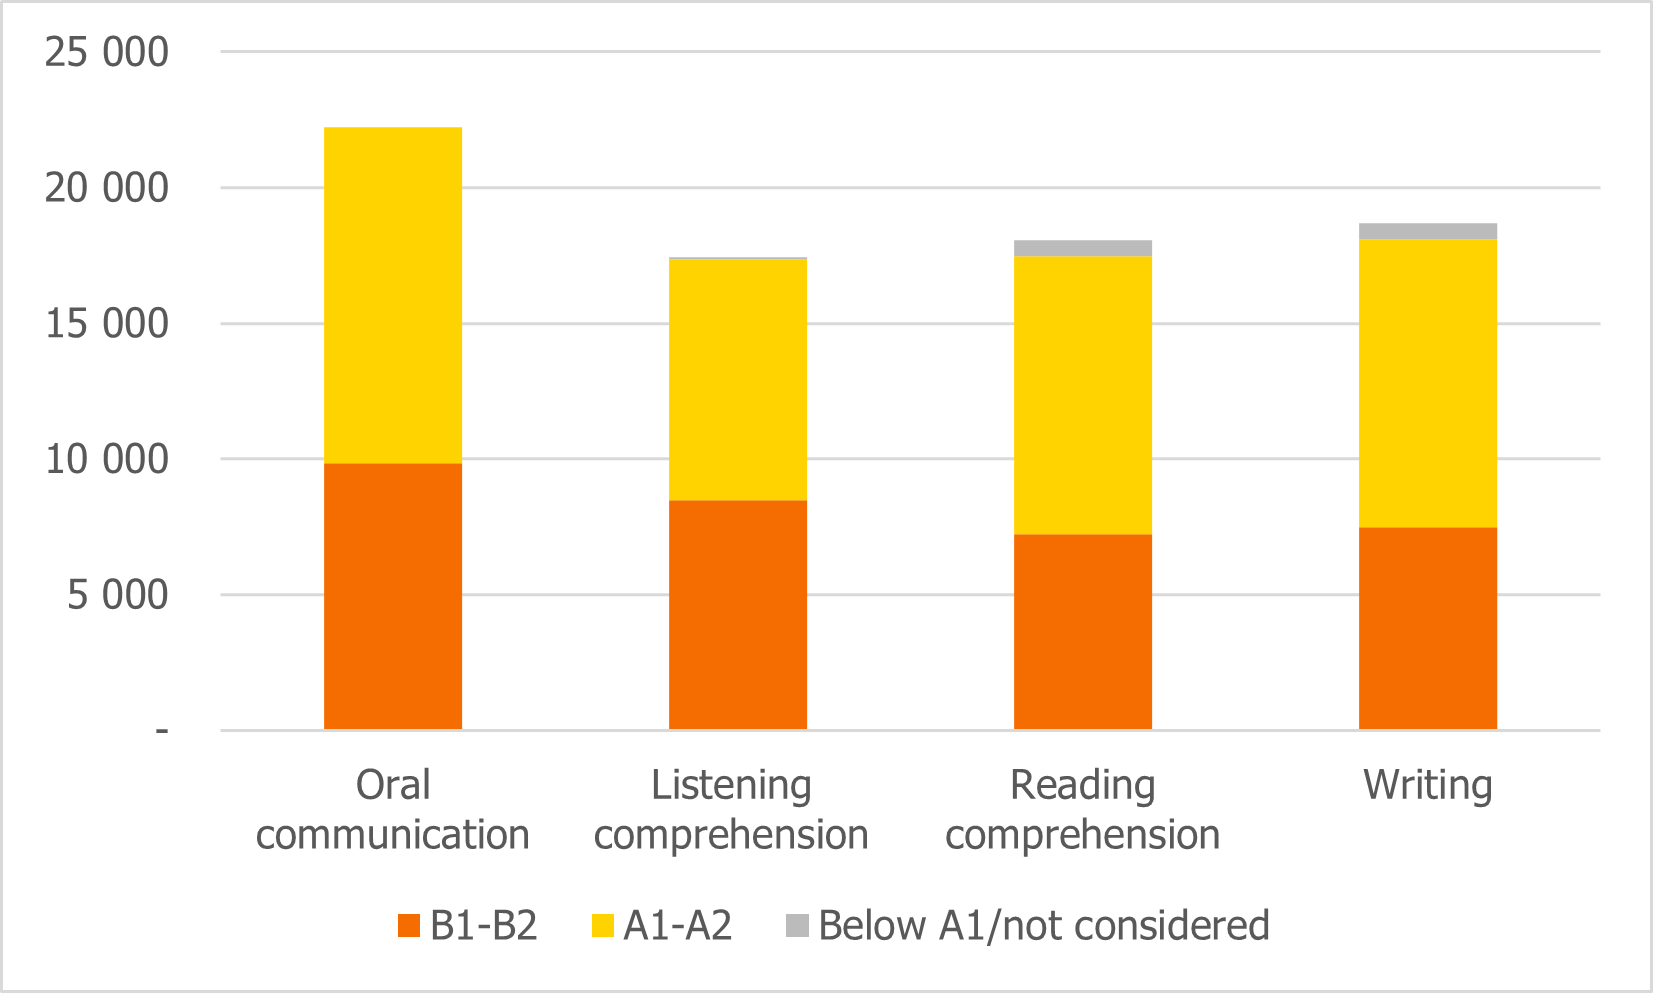
Norwegian language training pursuant to the Introduction Act has been organised into three “tracks”, where track 1 is for participants with little or no schooling from their home country, track 2 is for people with primary and lower secondary education from their home country, and track 3 is for participants with higher education. The target for tracks 2 and 3 is a Norwegian test at B1–B2 level. The statistics on the participants in Norwegian language training and social studies show that about a quarter were on track 1, and half were on track 2 in 2019. A fifth of the participants were on track 3, and the remainder (7 per cent) participated in tuition without tracks. The relative distribution into the different tracks has remained relatively stable over time (the Norwegian Institute for Adult Learning – Kompetanse Norge, 2019). Most tests (around 22,000) were taken in oral communication in 2019, with a few thousand fewer of the other types of tests. More than half of all the results showed language attainment at level A1 or A2.