Everyday integration
According to the government’s integration strategy, the objective for everyday integration is for immigrants to experience increased belonging and participation in society. Integration into everyday life happens when people meet physically or digitally, in formal and less formal settings, in small and large social arenas. Everyday integration is about creating trust, belonging, networks and participation. Everyday integration requires, first and foremost, effort from the individual immigrant. But it also requires that the immigrants encounter open mindedness and that their participation is enabled. As part of its work to promote everyday integration, the government will facilitate joint meeting places to prevent segregation and to promote understanding of fundamental values in Norwegian society. Other priority areas are settlement of refugees, provision of interpreters, and equal access to public services (Ministry of Education and Research, 2018).
Higher incidence of mental health problems in the immigrant population
There are large differences in health between different groups within the immigrant population. Country of origin, reason for immigration and length of period of residence in Norway have a major impact on health.
Refugees are generally in poorer health than people who come to Norway for family reunification, work or education (Norwegian Institute of Public Health, 2018).
Other factors that correlate with better physical and mental health are a high level of education, being in work and having a good financial situation. There is also a positive correlation between health and social integration. Experiences of discrimination and violence have a negative impact on health (Norwegian Institute of Public Health, 2018).
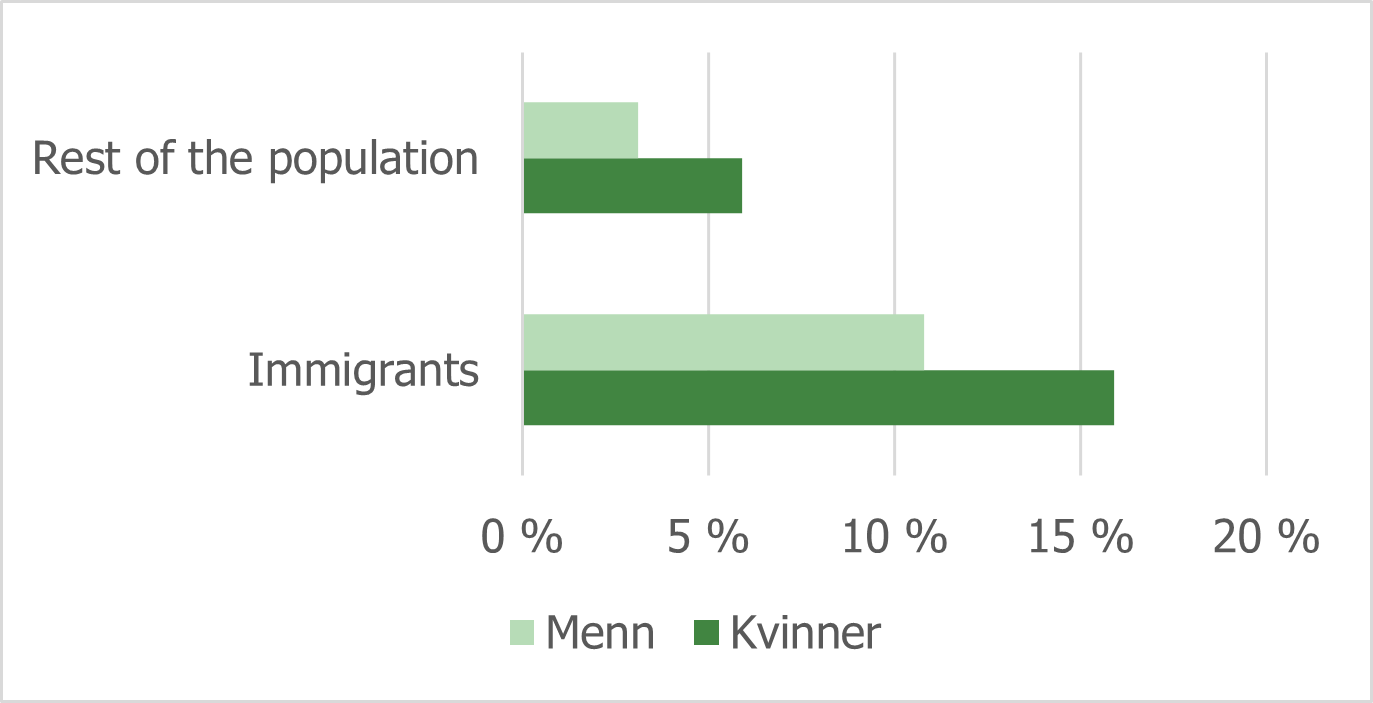
The survey of living conditions among immigrants (2017) indicates that a lower proportion of immigrants than the general population consider their health to be very good or good. Among the immigrant respondents, this figure was 73 per cent, compared with 83 per cent among the population as a whole. Yet the incidence of chronic illness and disability is approximately the same among immigrants and the population as a whole. By contrast, a higher proportion of immigrants have mental health problems. The proportion of people with mental health problems was particularly high among men and women from Turkey, Iraq, Iran and Pakistan and women from Afghanistan. A higher proportion of women than men reported mental health problems, both in the non-immigrant population and in all the immigrant groups, with the exception of Eritrea, Somalia and Iraq.
Figure 4.1: Self-reported mental health problems, broken down by immigrant category and sex. Per cent. (Vrålstad & Wiggen, 2017)
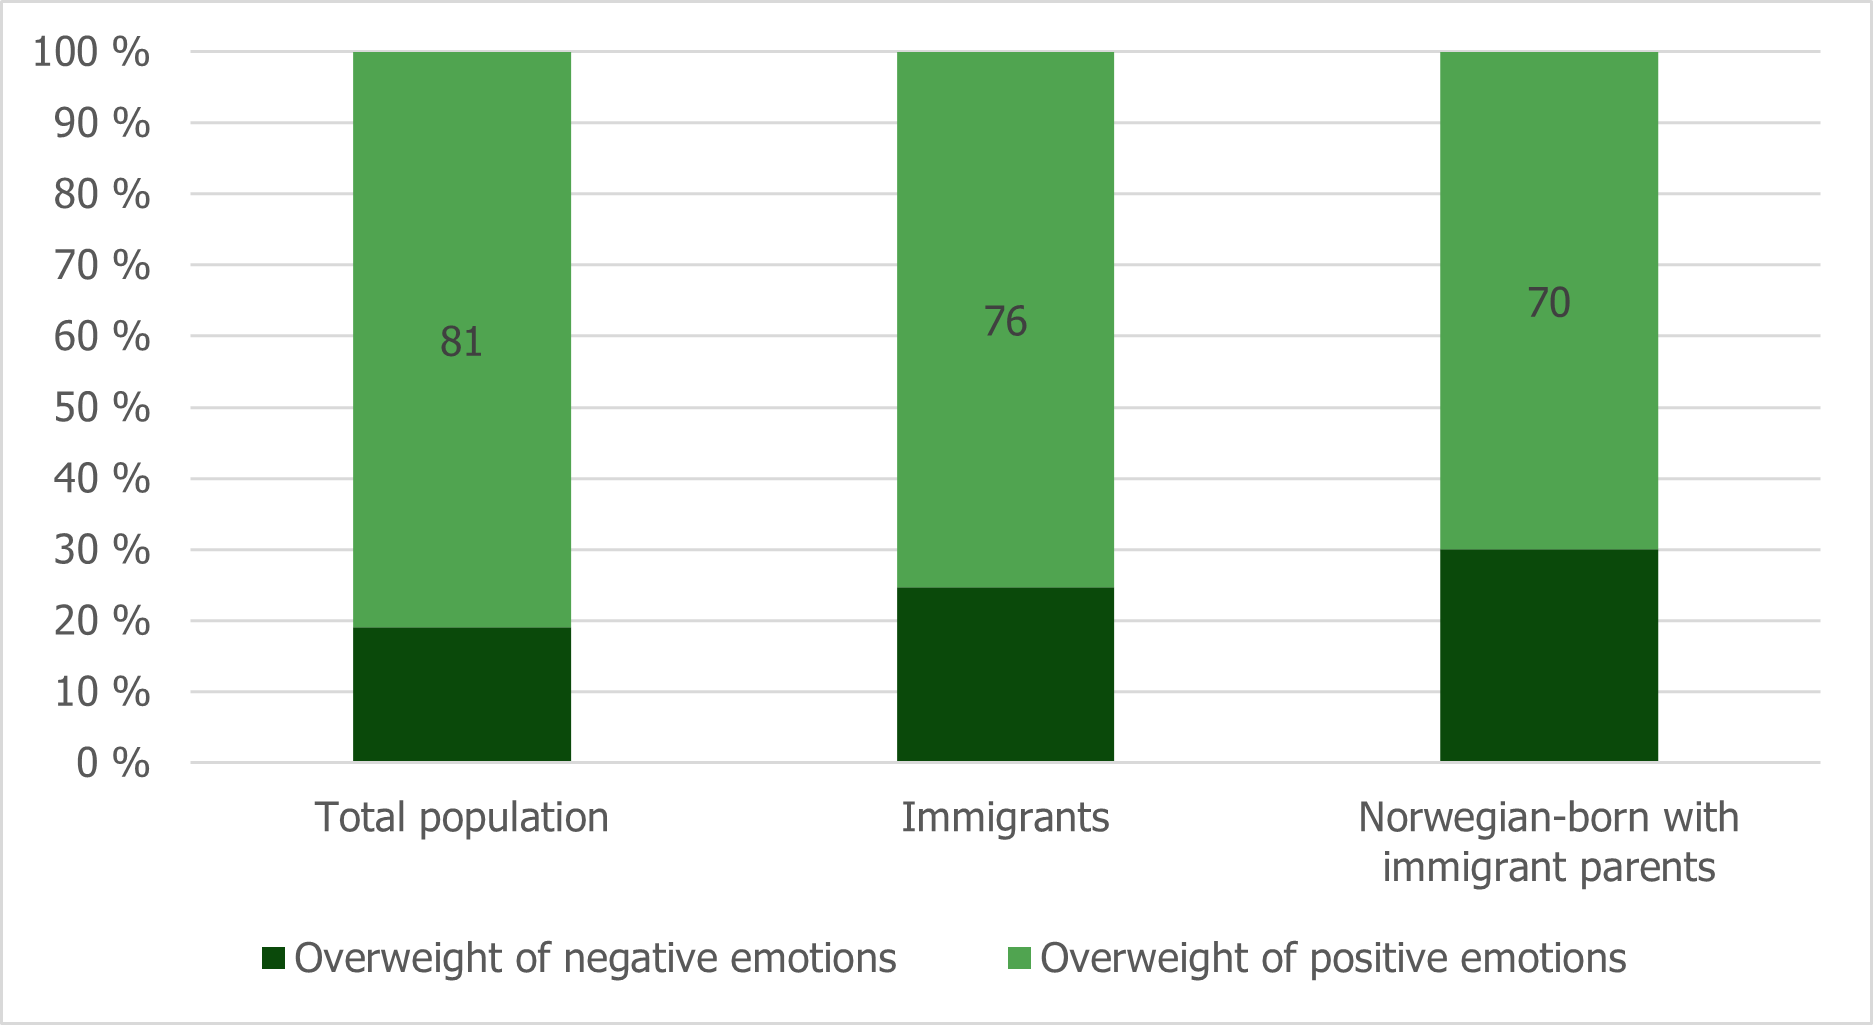
Statistics Norway (SSB) conducted a survey on quality of life in the Norwegian population in the period 9–29 March 2020 (Støren et al., 2020). Immigrants score significantly worse than the population on six out of 12 quality of life indicators: satisfaction with their place of residence, leisure, financial situation, experience of accomplishment, rewarding social relations, and predominance of positive emotions. By contrast, they score better than the general population on satisfaction with their physical and mental health. People born in Norway to immigrant parents score worse on eight out of 12 indicators, and no better than the population as a whole on any of the indicators.
Figure 4.2: Total score negative / positive feelings. Per cent. (Støren et al., 2020)
With regard to general satisfaction with life among people with an immigrant background, immigrants do not differ significantly from the rest of the population. By contrast, people born in Norway to immigrant parents score significantly lower than the population as a whole on general satisfaction with life: 30 per cent of people born in Norway to immigrant parents respond that they are not satisfied with life, compared with 22 per cent among the population as a whole. This may be due to the fact that, as a group, people born in Norway to immigrant parents are relatively young and that young people generally have a lower score on this indicator than the population as a whole. One weakness of this survey is that relatively few immigrants were included, and the response rate in this group was low.
Compound causes of high COVID-19 infection rates among immigrants
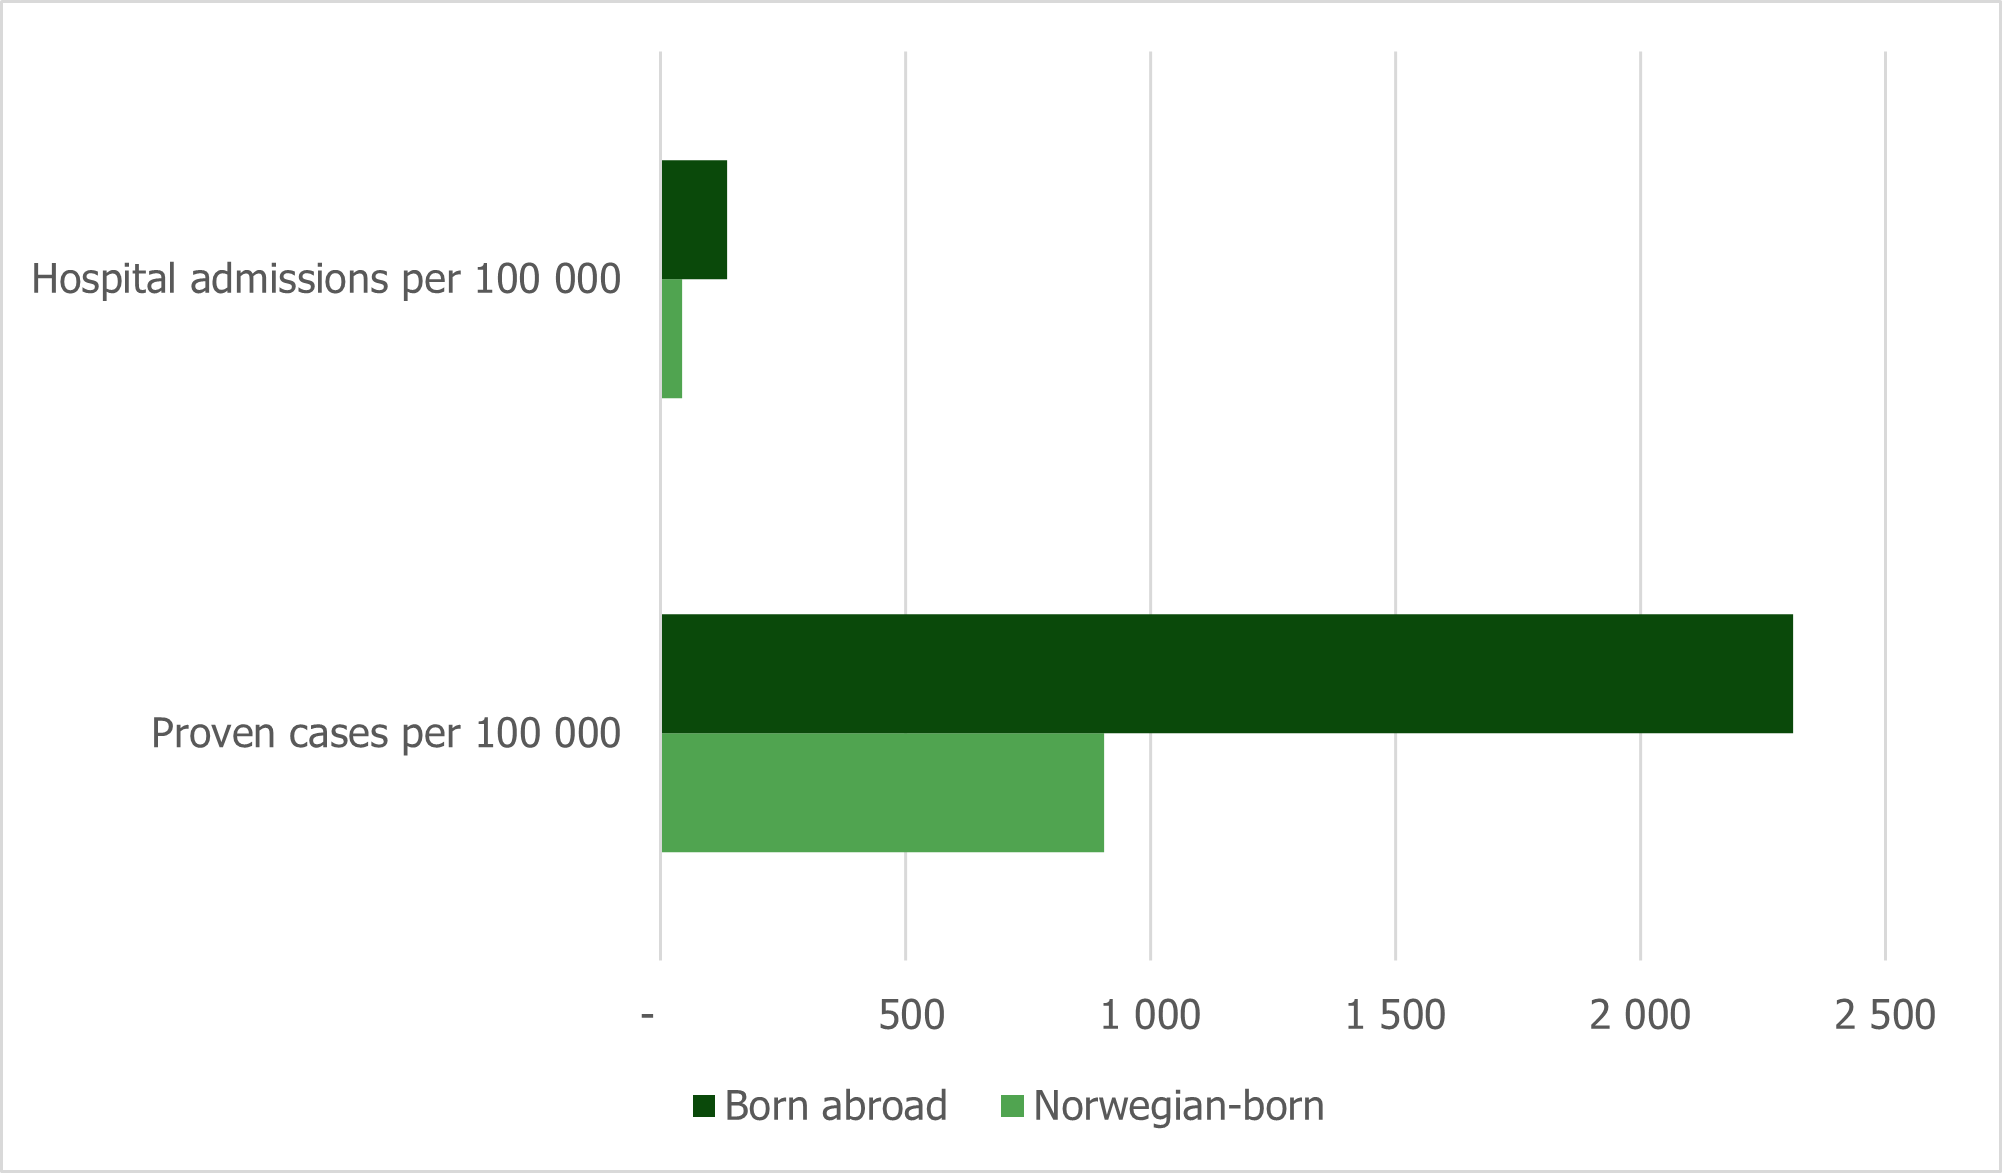
Immigrants have been harder hit by the pandemic in terms of both infections and serious illness (Indseth et al., 2021). In mid-February, the total number of people infected per 100,000 inhabitants in Norway was 906 among people born in Norway and 2,312 among immigrants. Among people born in Norway, about 44 per 100,000 have been admitted to hospital with COVID-19, compared with 136 per 100,000 among people born outside Norway. The proportion of people born in Norway per 100,000 who have been tested is 34 per cent, compared with 36 per cent for people born outside Norway, and the proportion who tested positive is significantly higher for foreign-born people (5.9 per cent versus 2.1 per cent).
Figure 4.3: Hospitalisations and confirmed cases of COVID-19, per 100,000 up to 15 February 2021. (Indseth et al., 2021)
There is considerable variation among the groups in terms of both confirmed SARS-CoV-2 infection and hospitalisations, but people born in Pakistan, Somalia, Iraq, Turkey and Afghanistan have been particularly hard hit. Foreign-born people are overrepresented among people requiring a ventilator, but slightly underrepresented in terms of death. There is still inadequate knowledge about the reasons for the differences between people born in Norway and people born elsewhere.
In their report, Indseth et al. (2021) investigate whether socioeconomic factors can explain why infection rates and hospitalisations are higher among immigrants than among people born in Norway. The conclusion is that adjusting for age, gender and municipality of residence results in a slight decrease in the degree of overrepresentation, although it is still high. It is not reduced any further if occupation, cramped living, medical risk groups, maximum educational attainment and household income are subsequently taken into account. Equivalising for all these socioeconomic factors at the same time reduces the level of overrepresentation by about 12 per cent for confirmed SARS-CoV-2 infection and 3 per cent for hospitalisation. However, despite this, there is still significant overrepresentation. Social inequalities, cramped living and medical risk groups explain differences within the country of birth groups, but not why the infection and hospitalisation rates are so much higher for some countries of birth.
In other words, the reasons why immigrants have been harder hit by the pandemic are complex, and more knowledge is needed about the background for overrepresentation in terms of infection rates and hospitalisations for some country groups. A government appointed expert committee will present up-to-date knowledge about which factors might explain these differences in summer 2021.
Lower trust in other people among immigrants
It is common to distinguish between horizontal trust and vertical trust. Horizontal trust indicates trust in other people, while vertical trust indicates confidence in key institutions in society. The Brochmann II Committee explored the extent to which immigration poses a challenge to social trust and cohesion in Norwegian society. Here it is argued that the experience of cohesion and social trust is best continued by focusing on inclusion of immigrants through society’s main institutions, such as working life and education (Official Norwegian Report – NOU, 2017:2).
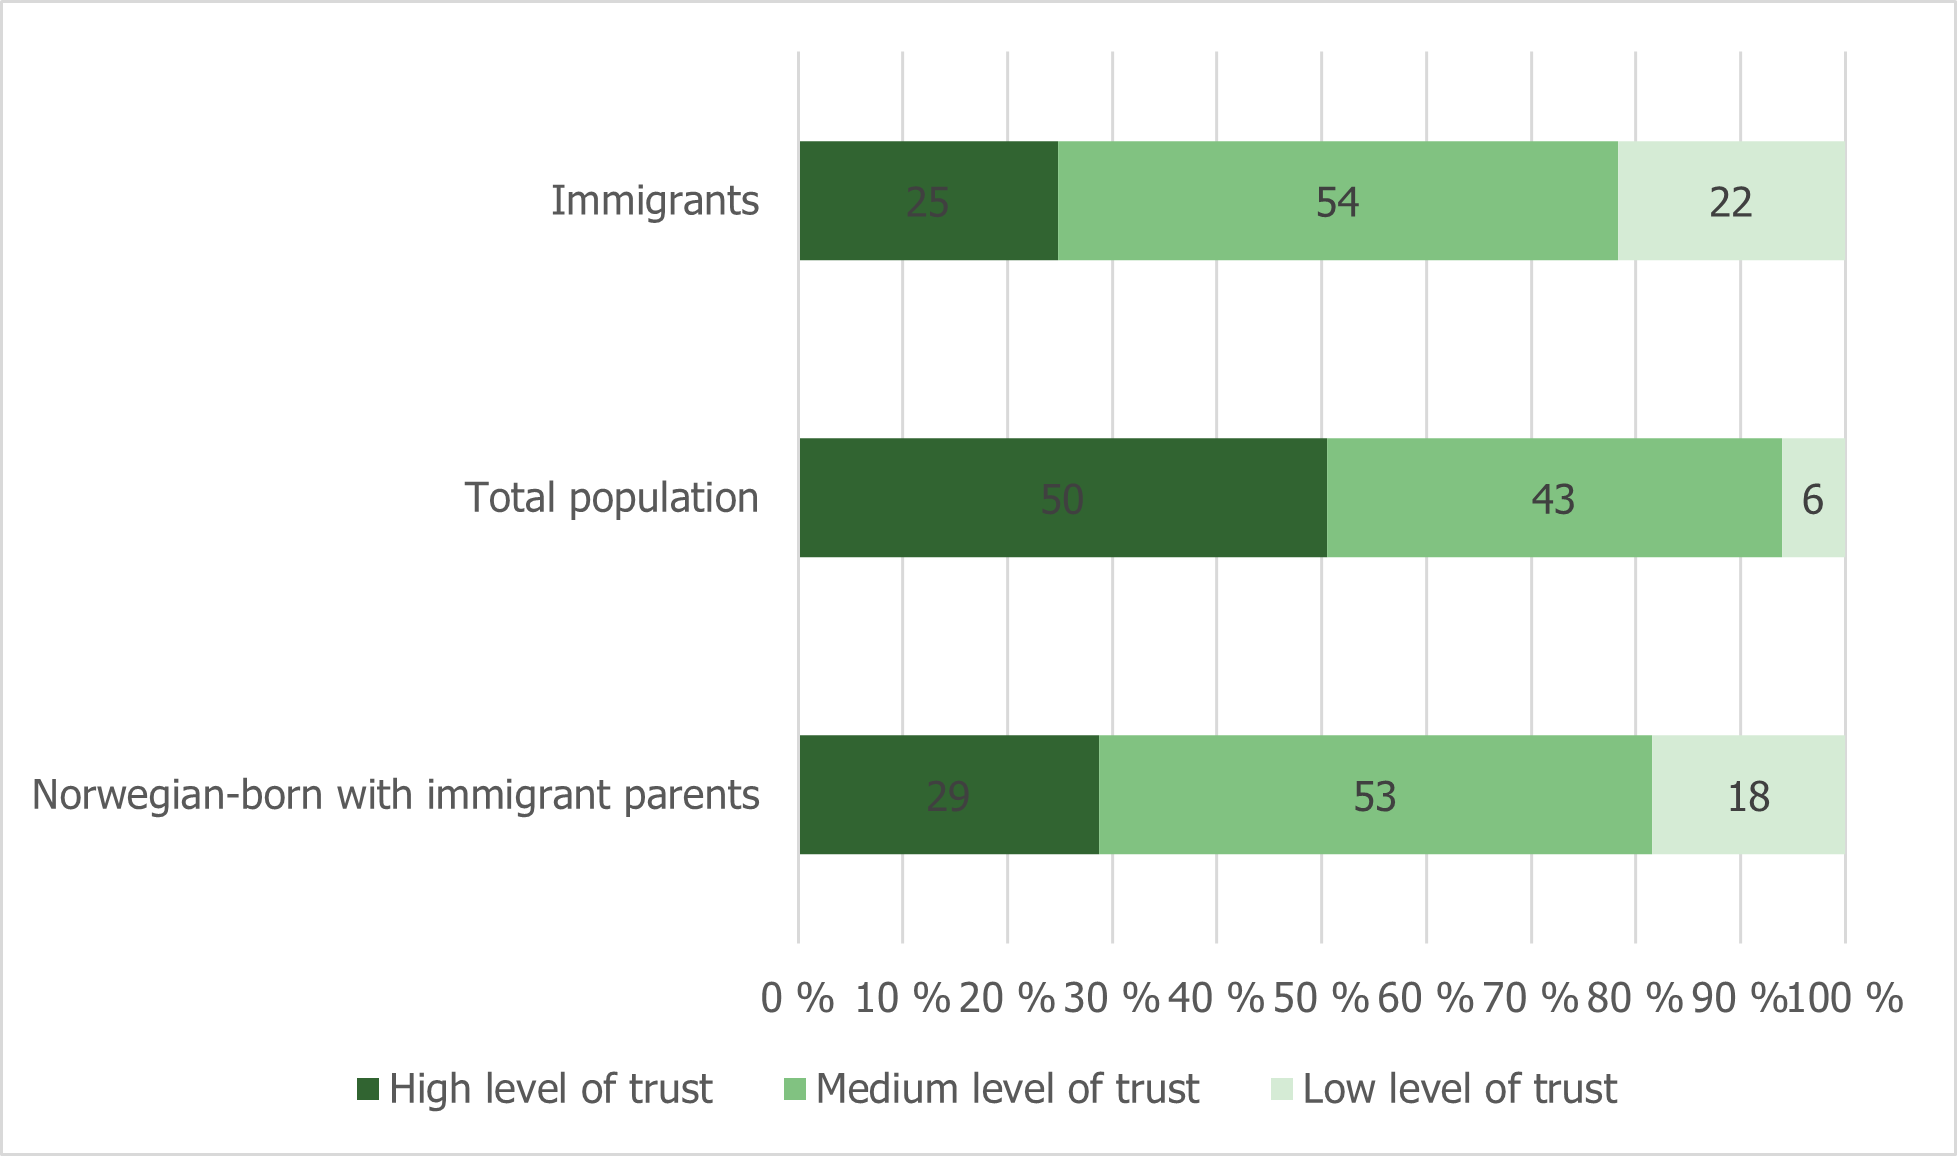
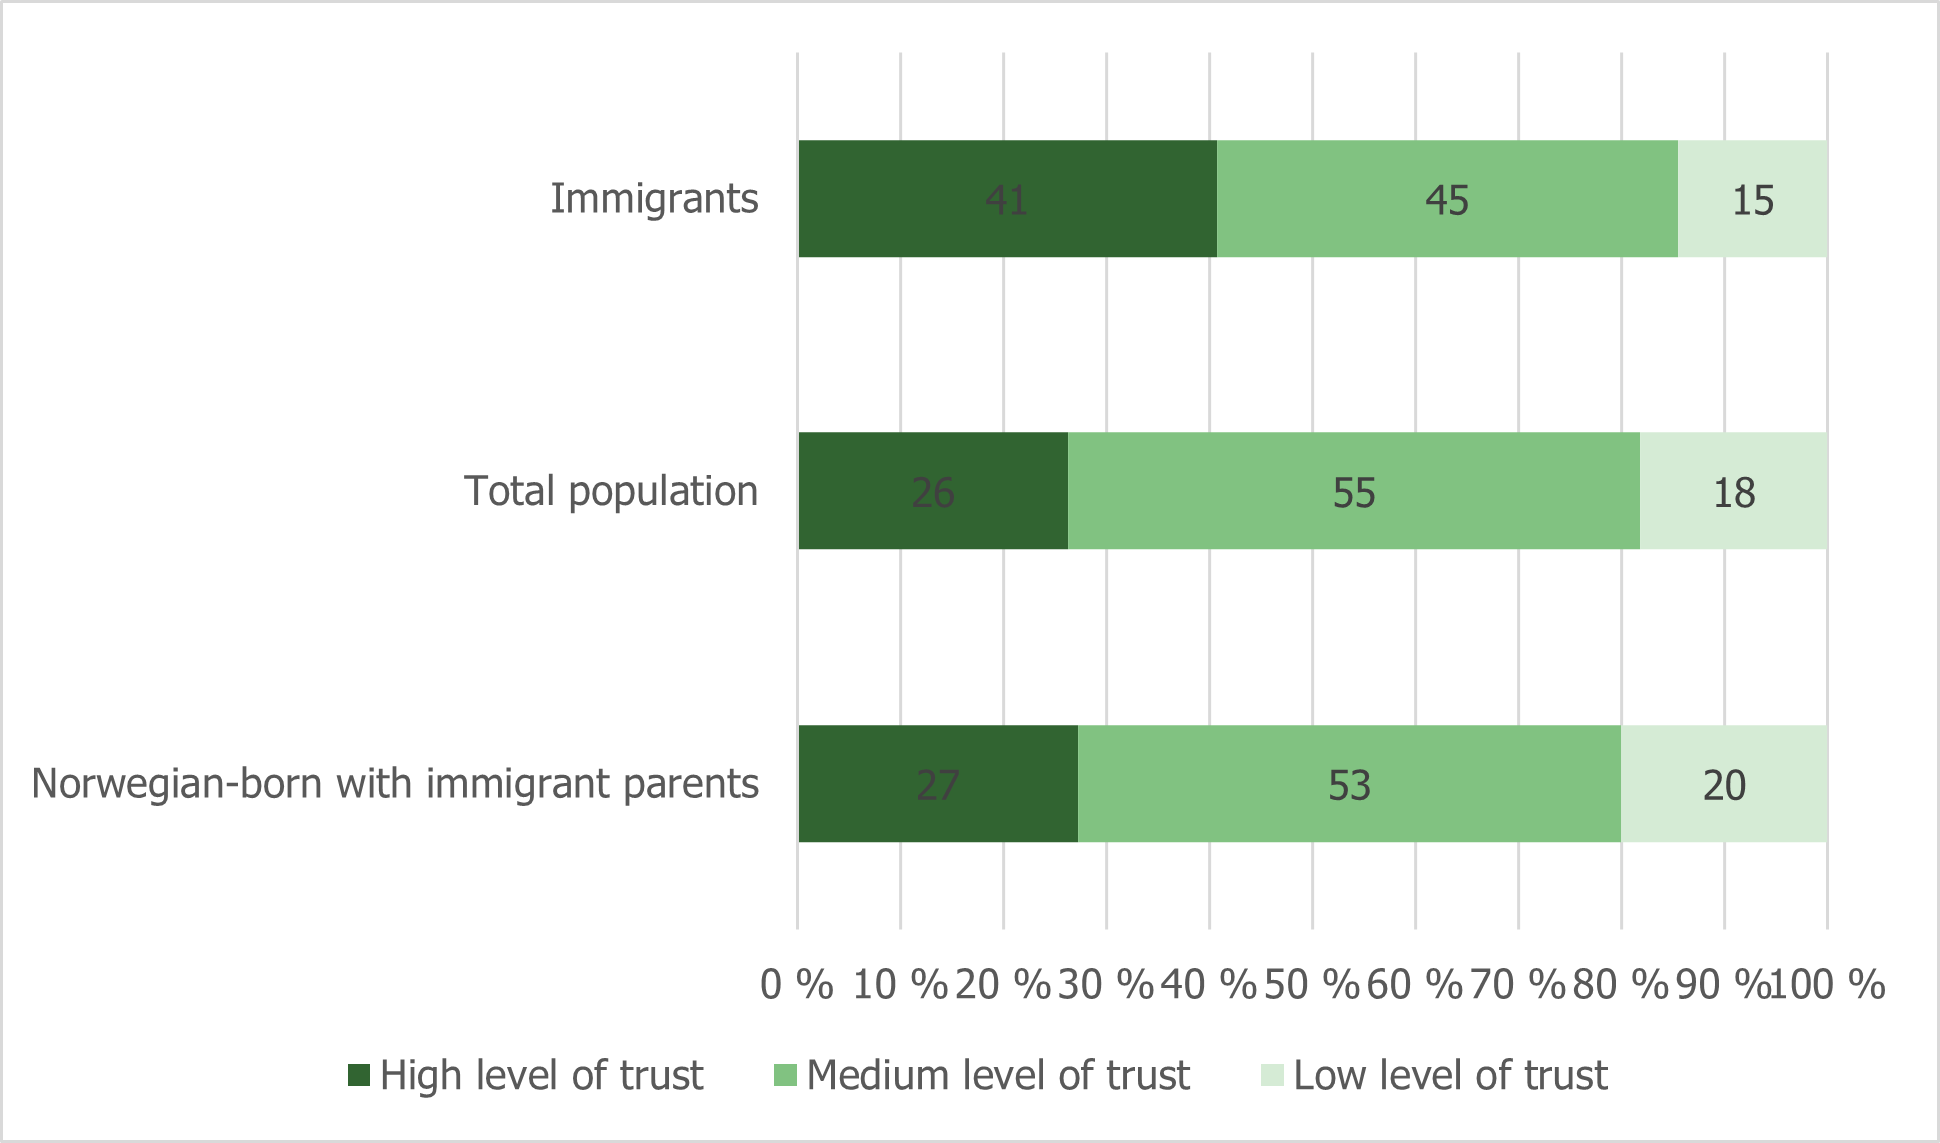
A question that is commonly used to measure horizontal trust is “Generally speaking, would you say that most people can be trusted, or that you can never be too careful when dealing with others?” This question was put to the immigrants included in Statistics Norway’s survey of living conditions (2017). Immigrants express less trust in other people, compared with the population as a whole: 22 per cent of immigrants express little trust in other people, compared with 6 per cent of the rest of the population. At the other end of the scale, 50 per cent of the population as a whole express a high level of trust, compared with 25 per cent of the immigrant population. People born in Norway to immigrant parents express on average slightly higher horizontal confidence than immigrants, but they have a lower level of trust than the rest of the population.
Figure 4.4: Trust in other people (Vrålstad & Wiggen, 2017)
There is also a correlation between horizontal trust and length of period of residence. There are more people with a low level of trust in other people than with a high level of trust among immigrants who have lived in Norway for a relatively short period of time. For immigrants with a long period of residence (15 years or more), this correlation has been inversed. In other words, it appears that the low level of trust in other people increases slightly with length of period of residence (Støren, 2019).
Vertical trust, or trust in social institutions, means that citizens are confident that public institutions are reliable and work well. A question to measure vertical trust is: “On a scale of 0 to 10, how much confidence do you, personally, have in the political system in Norway?” (Vrålstad & Wiggen, 2017). The results indicate that 41 per cent of the immigrant population expresses great trust in the political system. This is significantly higher than among the population as a whole (26 per cent). In all 12 country groups, trust in the political system is measured as higher than or on par with in the population as a whole. Immigrants with a short period of residence (2–4 years) express the highest level of trust in the political system, and it thus appears that the high level of trust that immigrants have in the political system in Norway decreases over time. It is not certain that the differences between immigrants with different lengths of period of residence is actually due to how long they have lived in Norway per se; rather, it may be due to the differences between these groups. The results also show that trust in the political system is greatest among people who immigrated when they were 40 years of age or older and lowest among people who immigrated as children. On average, trust in the police is slightly higher among immigrants, and trust in the judiciary is on par with the rest of the population (Støren, 2019).
Figure 4.5: Trust in the political system (Vrålstad & Wiggen, 2017).
Increasing contact with immigrants in different arenas
In line with the increase in the proportion of immigrants in Norway over the past twenty years, more and more people are coming into contact with immigrants. This proportion has increased from two out of three in 2002 to four out of five in 2020 (Statistics Norway – SSB, 2020f). In the “Integration Barometer” from 2020, about half of the respondents stated that they had contact with immigrants at least once a week, while just under a third had monthly contact.
Figure 4.6: Arenas for contact with immigrants (Statistics Norway – SSB, 2020f)
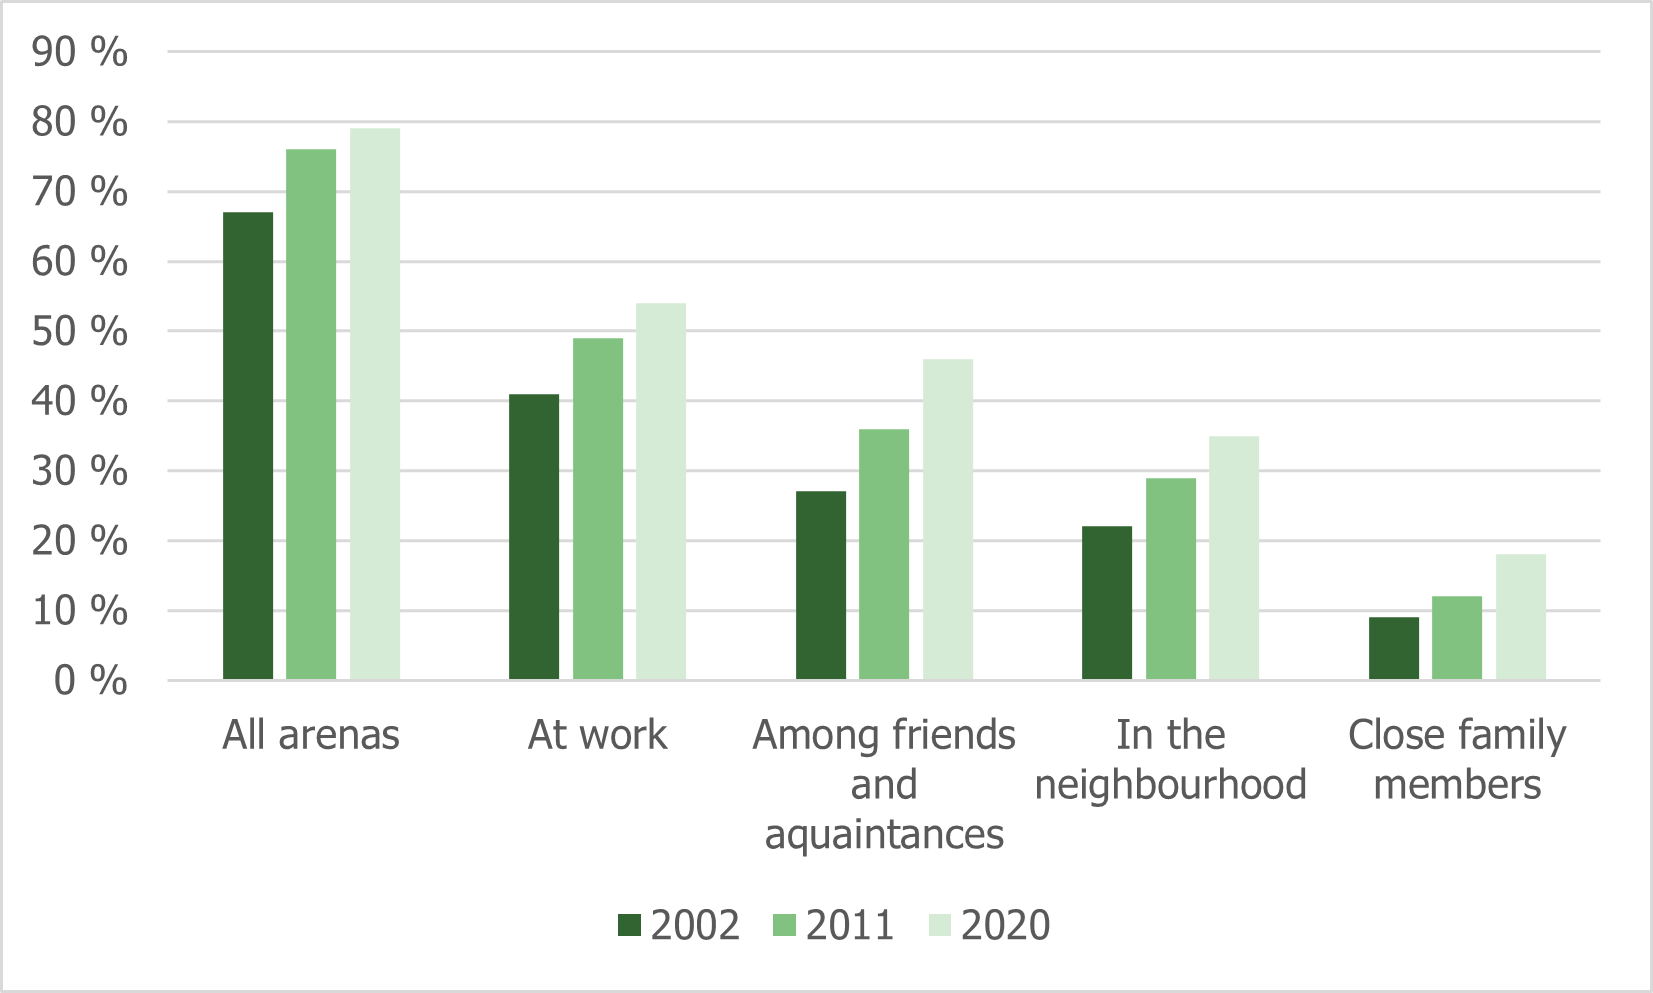
Contact with immigrants can take place in a variety of different arenas. Some people have immigrants in their close family, as friends, or as colleagues at work. There may also be contact in their neighbourhood, on the street, or in other ways. Figure 4.6 shows that today more people in Norway have contact with immigrants in all arenas compared with 2002. This largest increase has been in close family and among friends and acquaintances. In 2020, there were twice as many immigrants in people’s close family as in 2002, while the proportion of people who knew or were friends with immigrants increased from 27 to 46 per cent in the same period. Immigrants experience more loneliness and social exclusion than the rest of the population. Immigrants from Asia, Africa, etc. are most at risk – in this group, 37 per cent felt excluded from society to a significant degree, compared with 14 per cent among the population without an immigrant background. The proportion who frequently felt lonely was also almost three times higher: 24 per cent against 9 per cent (Barstad, 2021).
Figure 4.7: The proportion of people who experience loneliness or exclusion, broken down by immigrant category. (Barstad, 2021)
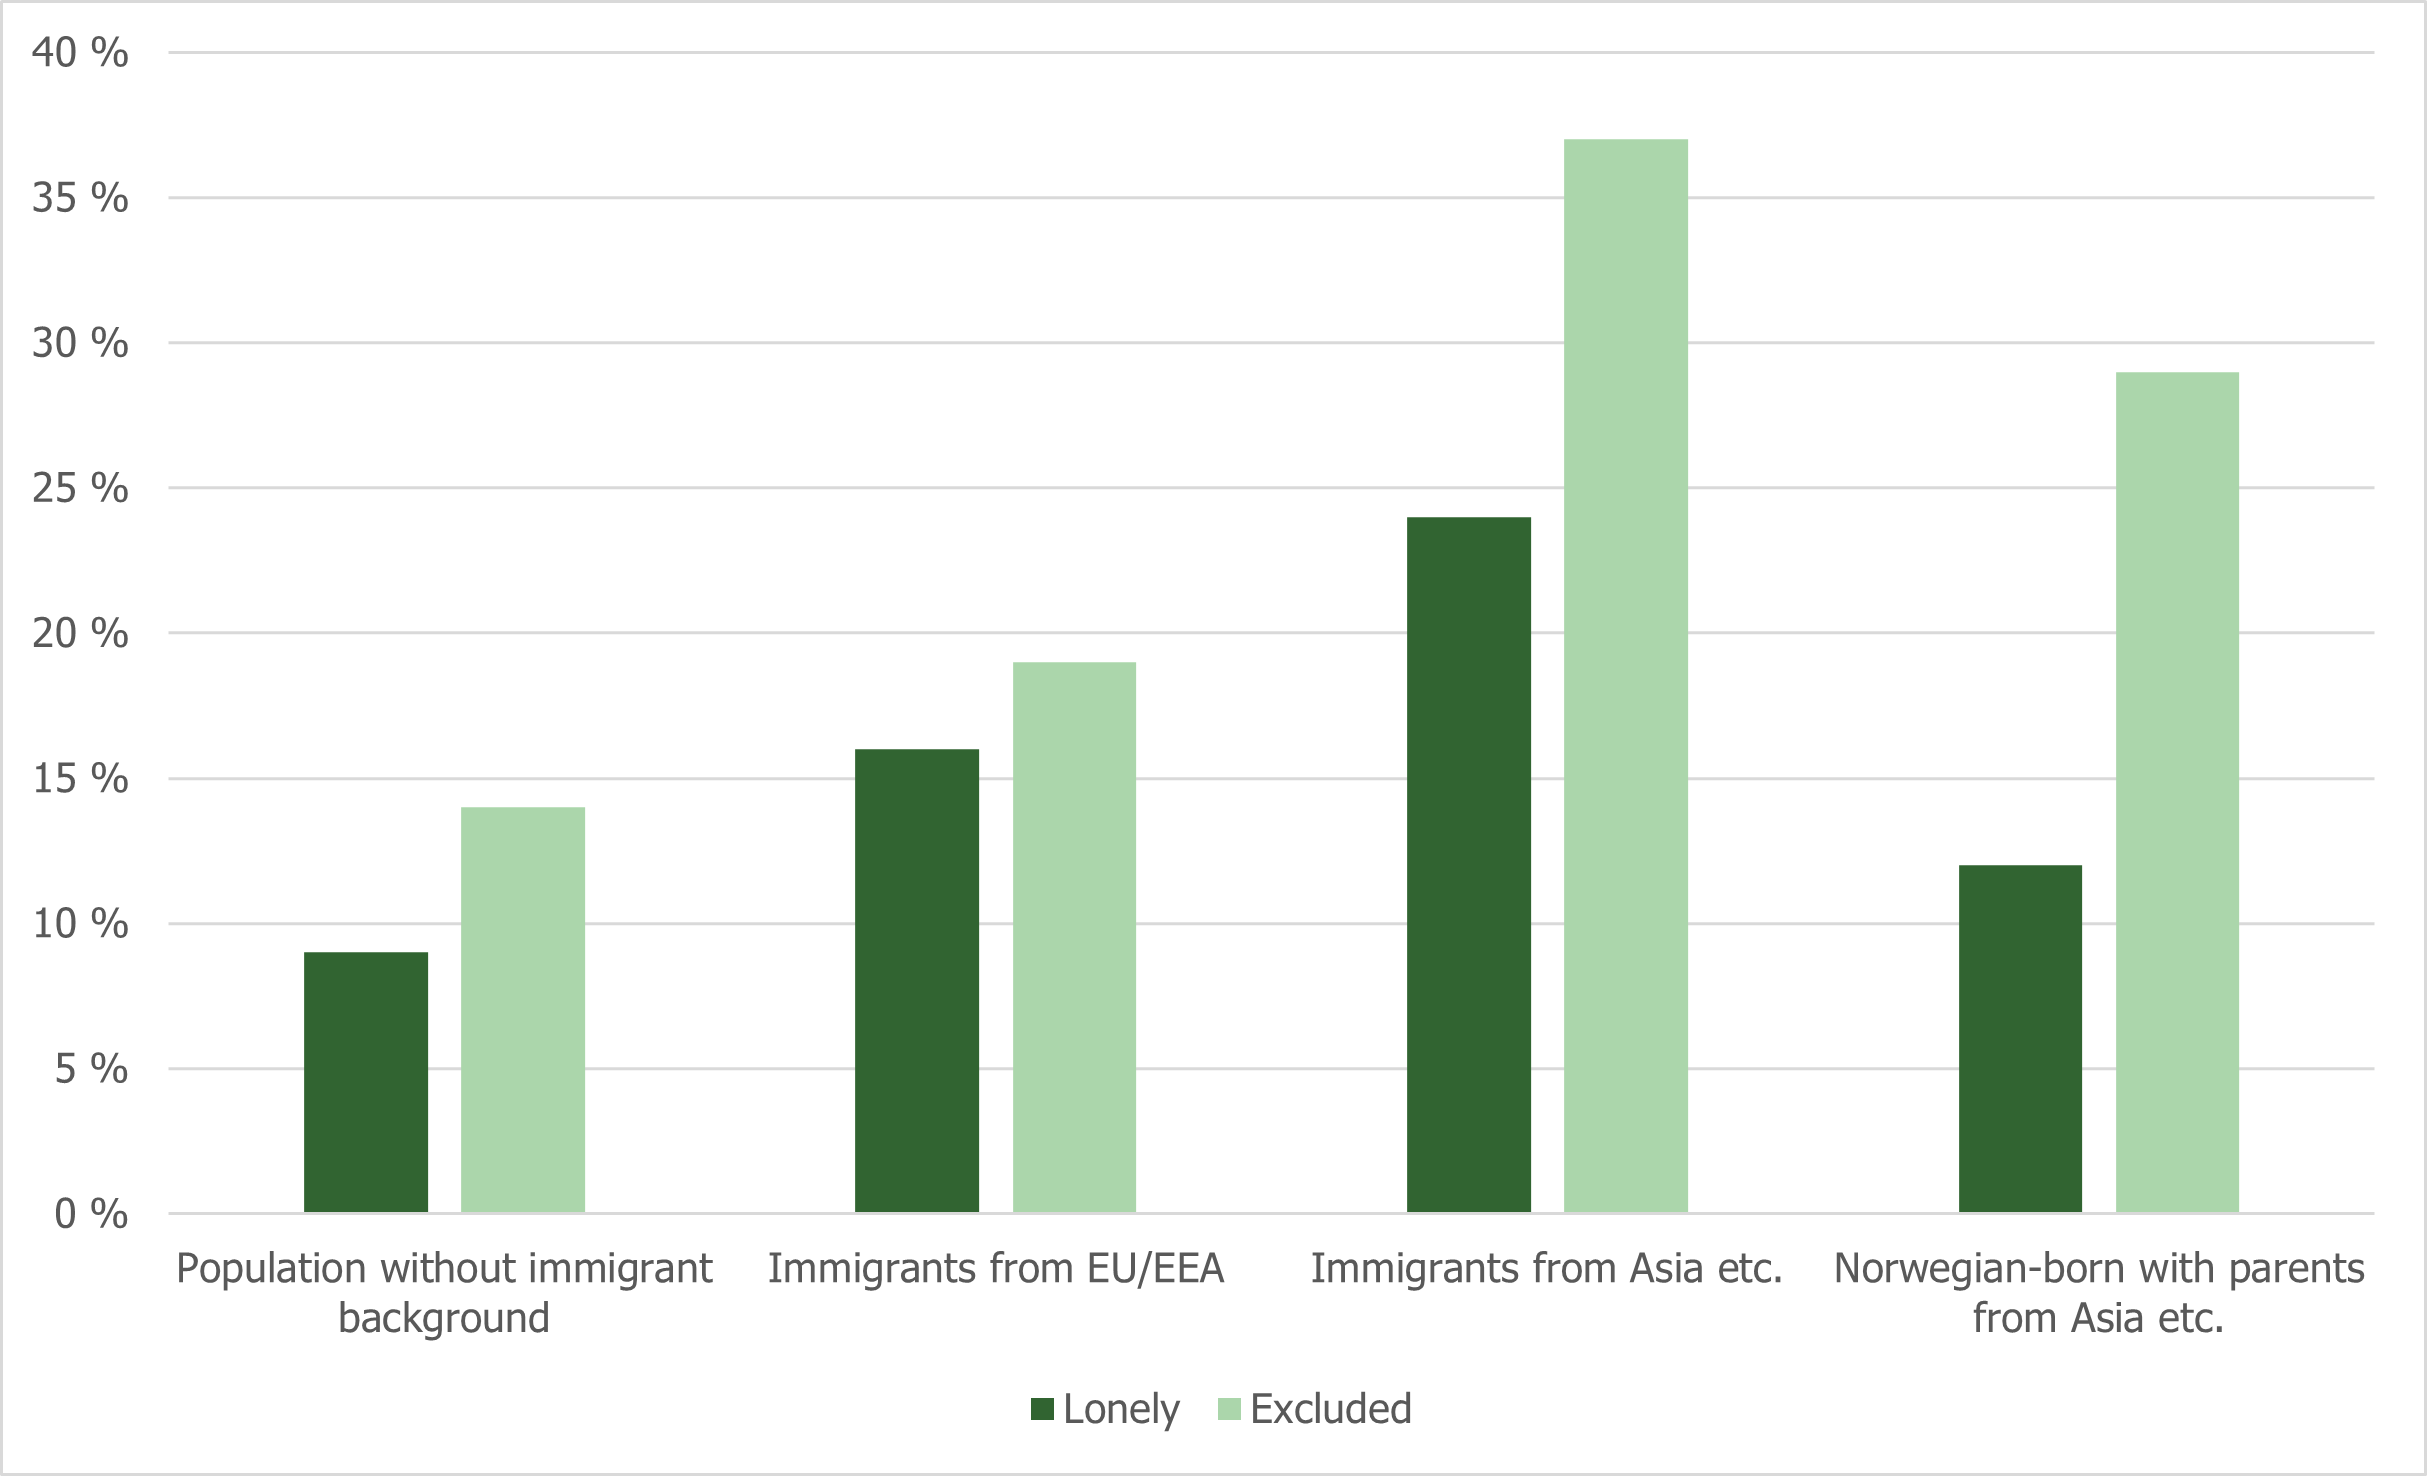
There is scarcely any difference between people born in Norway to immigrant parents from Asia, Africa, etc. and the non-immigrant population when it comes to loneliness. By contrast, a large share (almost 30 per cent) of this group reported feeling socially excluded (Barstad, 2021).
What then might be the causes of the fact that some immigrants – primarily from Asia, Africa, etc. – experience more loneliness and social exclusion? Statistics Norway’s analysis shows that the differences in experience of loneliness can largely be attributed to the fact that immigrants from Asia, Africa, etc. have lower maximum educational attainment, a weaker financial situation, slightly poorer health, and participate less in the labour market. In respect of social exclusion, the analysis concludes that immigrants from Asia, Africa, etc. experience more social exclusion, even after differences in living conditions, financial situation and social relations are taken into account.
Refugees and family immigrants participate more in voluntary work
Voluntary organisations are important arenas for integration and social participation. Involvement in voluntary work provides access to social meeting places and opportunities to build social networks and be included in the local community.
Several surveys on immigrants’ participation in voluntary work show that immigrants participate to a lesser degree than the rest of the population (Eimhjellen et al., 2021). According to the figures from the survey of living conditions among the immigrant population, 17 per cent of the immigrant sample were involved in voluntary work, compared with 39 per cent in the rest of the population. Among the people who do voluntary work, involvement in sports is the most popular, among immigrants (30 per cent) and the rest of the population (43 per cent) alike. In the immigrant sample, voluntary work for non-profit and humanitarian organisations, human rights organisations and environmental organisations is the second most popular, and there are also many more of these types of volunteers in the immigrant sample than in the majority population sample. In addition, many of the volunteers in the immigrant sample volunteer in cultural organisations and religious organisations (Eimhjellen & Arnesen, 2018).
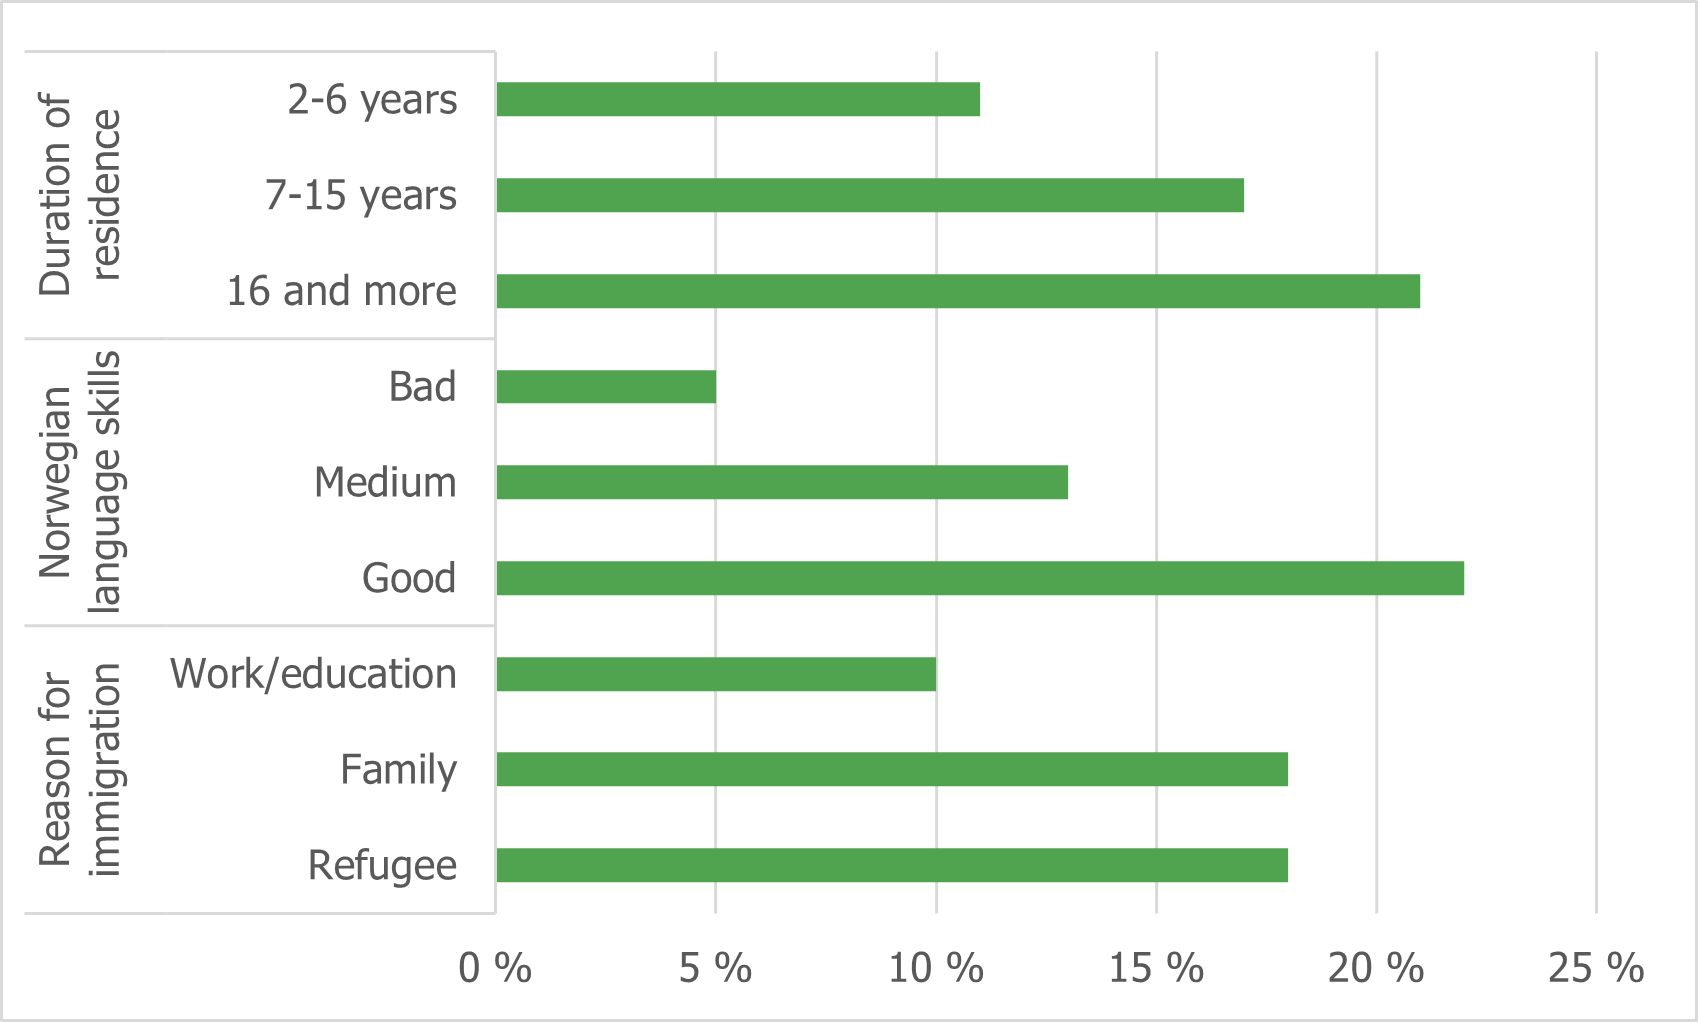
Participation in voluntary work varies according to the immigrants’ age, reason for immigration, and socioeconomic status. Immigrants who are older, have a low level of education, or are out of work participate less, as can be seen from Figure 4.8.
Figure 4.8: Participation in voluntary work in the immigrant sample, broken down by various characteristics. 2016 (Eimhjellen & Arnesen, 2018)
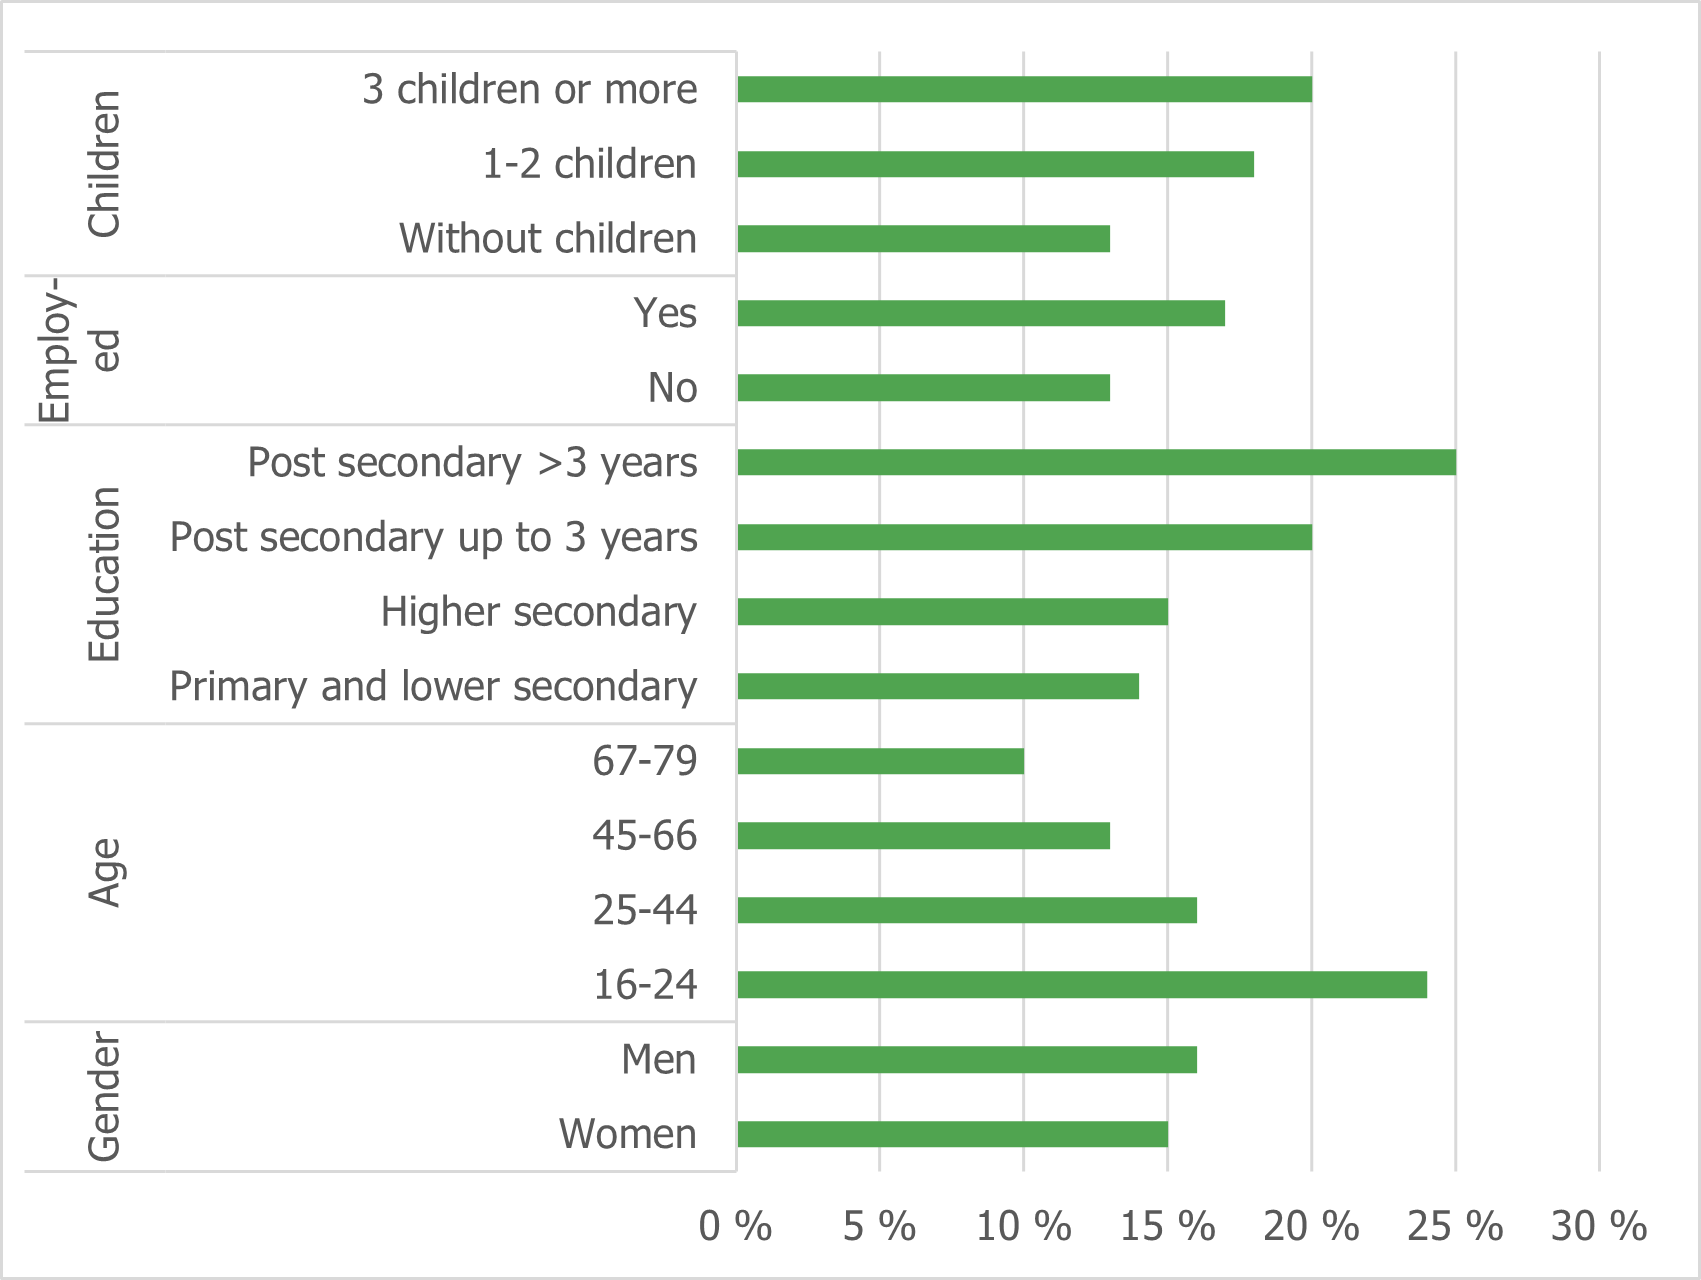
Having children also seems to have a positive effect on volunteering. A fifth of immigrants with three or more children responded in the survey on living conditions that they participate in voluntary activities. The corresponding share for immigrants without children was 13 per cent. When immigrant-specific characteristics are also taken into account, the results show that participation in voluntary work is higher among immigrants with a long period of residence and a good command of Norwegian. For example, Figure 4.9 demonstrates that immigrants who have lived in Norway for 16 years or more had twice as high participation in voluntary work as immigrants who have lived in Norway for two to six years.
Refugees and family immigrants generally participated to a greater extent in voluntary work than labour immigrants and people who came to Norway to study. There may be several reasons for this, and it may be related, among other things, to their relatively short period of residence, as well as the fact that the individuals in this group are largely focused on working or studying and have a shorter horizon for their planned stay in Norway.
Figure 4.9: Participation in voluntary work in the immigrant sample, broken down by various immigrant-specific characteristics. 2016 (Eimhjellen & Arnesen, 2018)
There is also a correlation between religious faith and religiosity and volunteering. Immigrants who are more active in religious organisations also have higher participation in secular organisations. In general, Muslims are the most active in non-religious voluntary work, while Christians are the least active (Barstad, 2019).
There are small differences in participation in volunteering between people born in Norway to immigrant parents and their peers in the rest of the population, according to the 2016 survey on living conditions in the immigrant population. In the age group 16–39 years, 32 per cent of the descendants of immigrants and 35 per cent of a sample of the general population stated that they had carried out work for an organisation for free (Dalen, 2019).
Lower participation in leisure activities, especially among girls with immigrant parents
There are clear differences in participation in leisure activities between young people with and without an immigrant background. Findings from the national Ungdata surveys on young people shows a correlation between upper secondary school pupils’ degree of participation in leisure activities and the national background of their parents. Young people with parents from countries in Asia and Eastern Europe participated less in leisure activities than others. In addition, there are more pronounced differences between girls and boys’ participation in leisure activities among young people with foreign-born parents than among young people with parents born in Norway.
Figure 4.10: Regular participation in organised leisure activities, broken down by sex and parents’ national background. Upper secondary school pupils (Jacobsen et al., 2021)
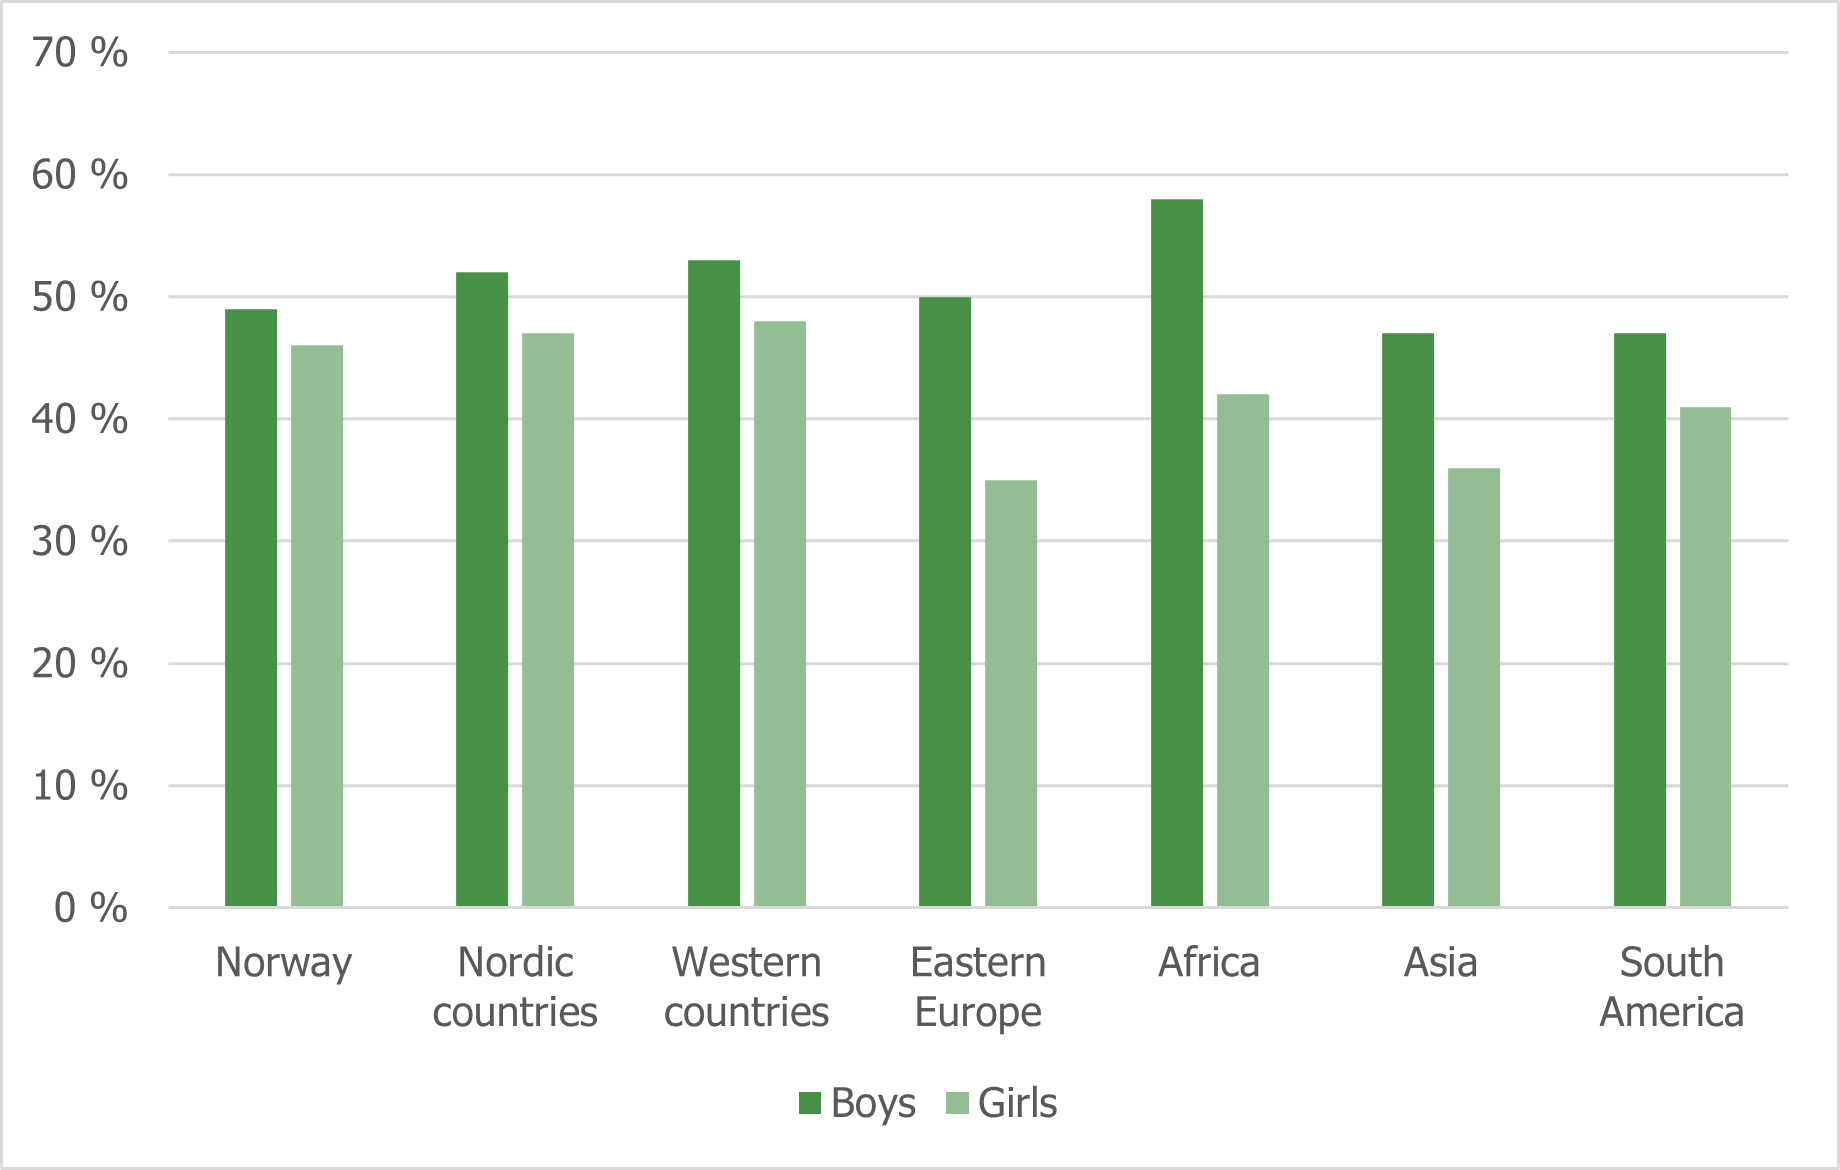
Among young people with parents born in Norway, 49 per cent of the boys and 46 per cent of the girls participated regularly in activities in their free time, constituting a difference of three percentage points. Among young people with an immigrant background from Africa and Eastern Europe, the corresponding difference was about five times bigger, amounting to 16 and 15 percentage points, respectively. Broken down by type of organisation, minority girls were most strongly underrepresented in sports, and especially girls with a background from Africa and Asia. Participation in sports among boys with an immigrant background from these countries was about twice as high as among girls with the same background (Jacobsen et al., 2021).
Place of residence also has an impact on participation in leisure activities. There are minor differences according to county and degree of centrality, but major variations between the individual municipalities within each county. The analysis suggests that the differences in participation among young people with and without an immigrant background are reduced somewhat when equivalised for their parents’ socioeconomic status and municipality of residence. Taking these factors into account results in a reduction in the probability of participating in leisure activities among young people with parents born in Norway, the Nordic countries or Western countries. Similarly, young people with a background from the other groups of countries, and especially from Africa, are then more likely to participate in leisure activities (Jacobsen et al., 2021).
Several surveys among children and young people in Oslo (Dalen, 2021; Ødegard & Fladmoe, 2017) show that there is generally a lower degree of participation in leisure activities among young people with a minority background in the capital too. At the same time, there is marked variation between different urban districts, with young people living in western urban districts being the most active. The same applies to children from households where the parents have a high income and a high level of education.
Stable lower election participation among immigrants
Figure 4.11: Voting participation in parliamentary and municipal elections among persons with Norwegian citizenship, 2013–2017 (Kleven, 2017; Statistics Norway – SSB, 2019k)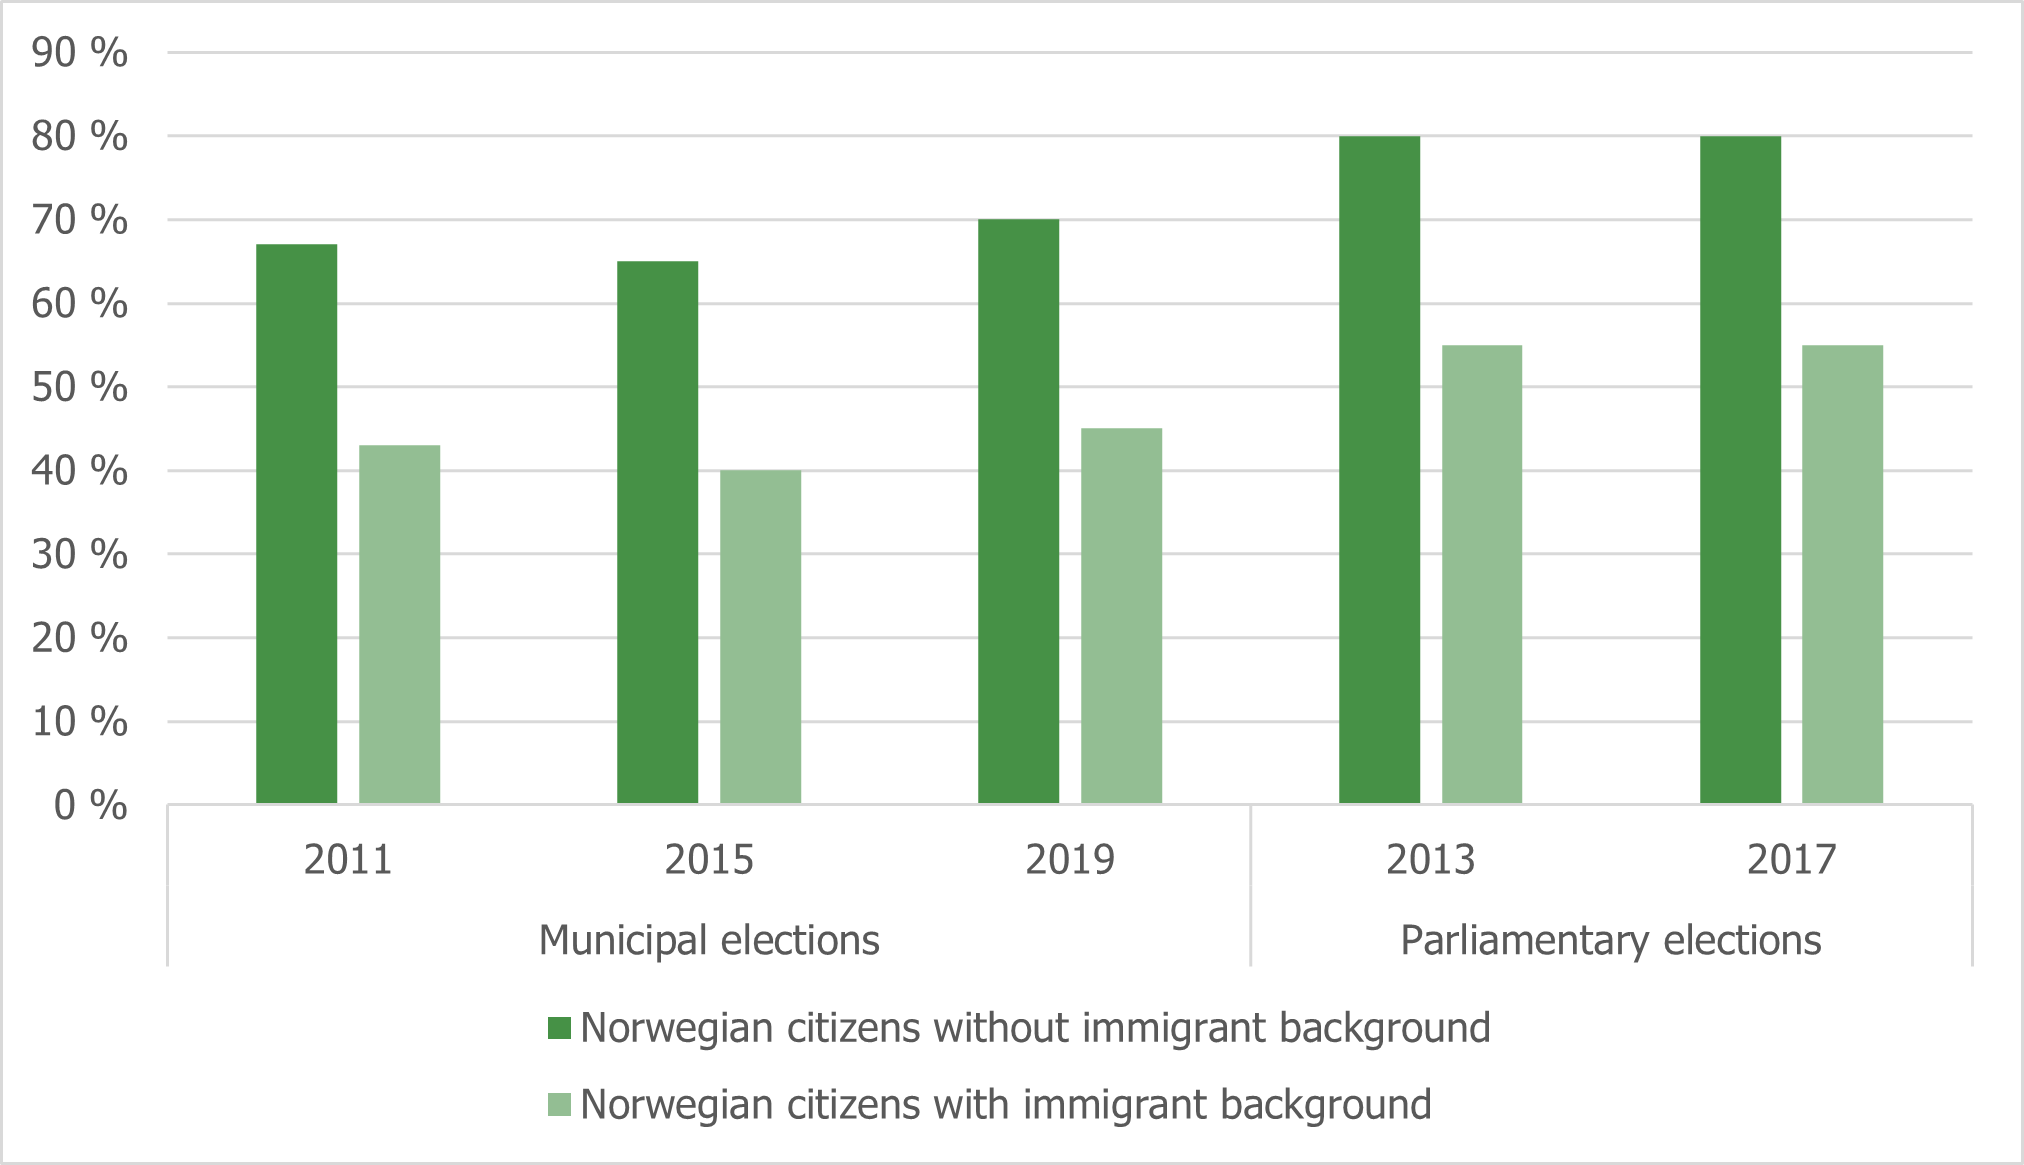
Only Norwegian citizens can vote in parliamentary elections in Norway. By contrast, foreign nationals with a minimum of three years’ lawful residence in Norway can vote in municipal elections.
The figure above shows that immigrants vote less than the rest of the population in both parliamentary elections and municipal elections. This difference in election participation has remained stable in recent years. At the last two parliamentary elections, election participation was 80 per cent for Norwegian citizens without an immigrant background, and 55 per cent among immigrants. Fewer people vote in municipal elections, compared with parliamentary elections, regardless of whether they have an immigrant background or not. However, election participation among immigrants in municipal elections has also been consistently lower than the rest of the population. Less than half voted at the last three municipal elections, compared with around two-thirds of Norwegian citizens without an immigrant background.
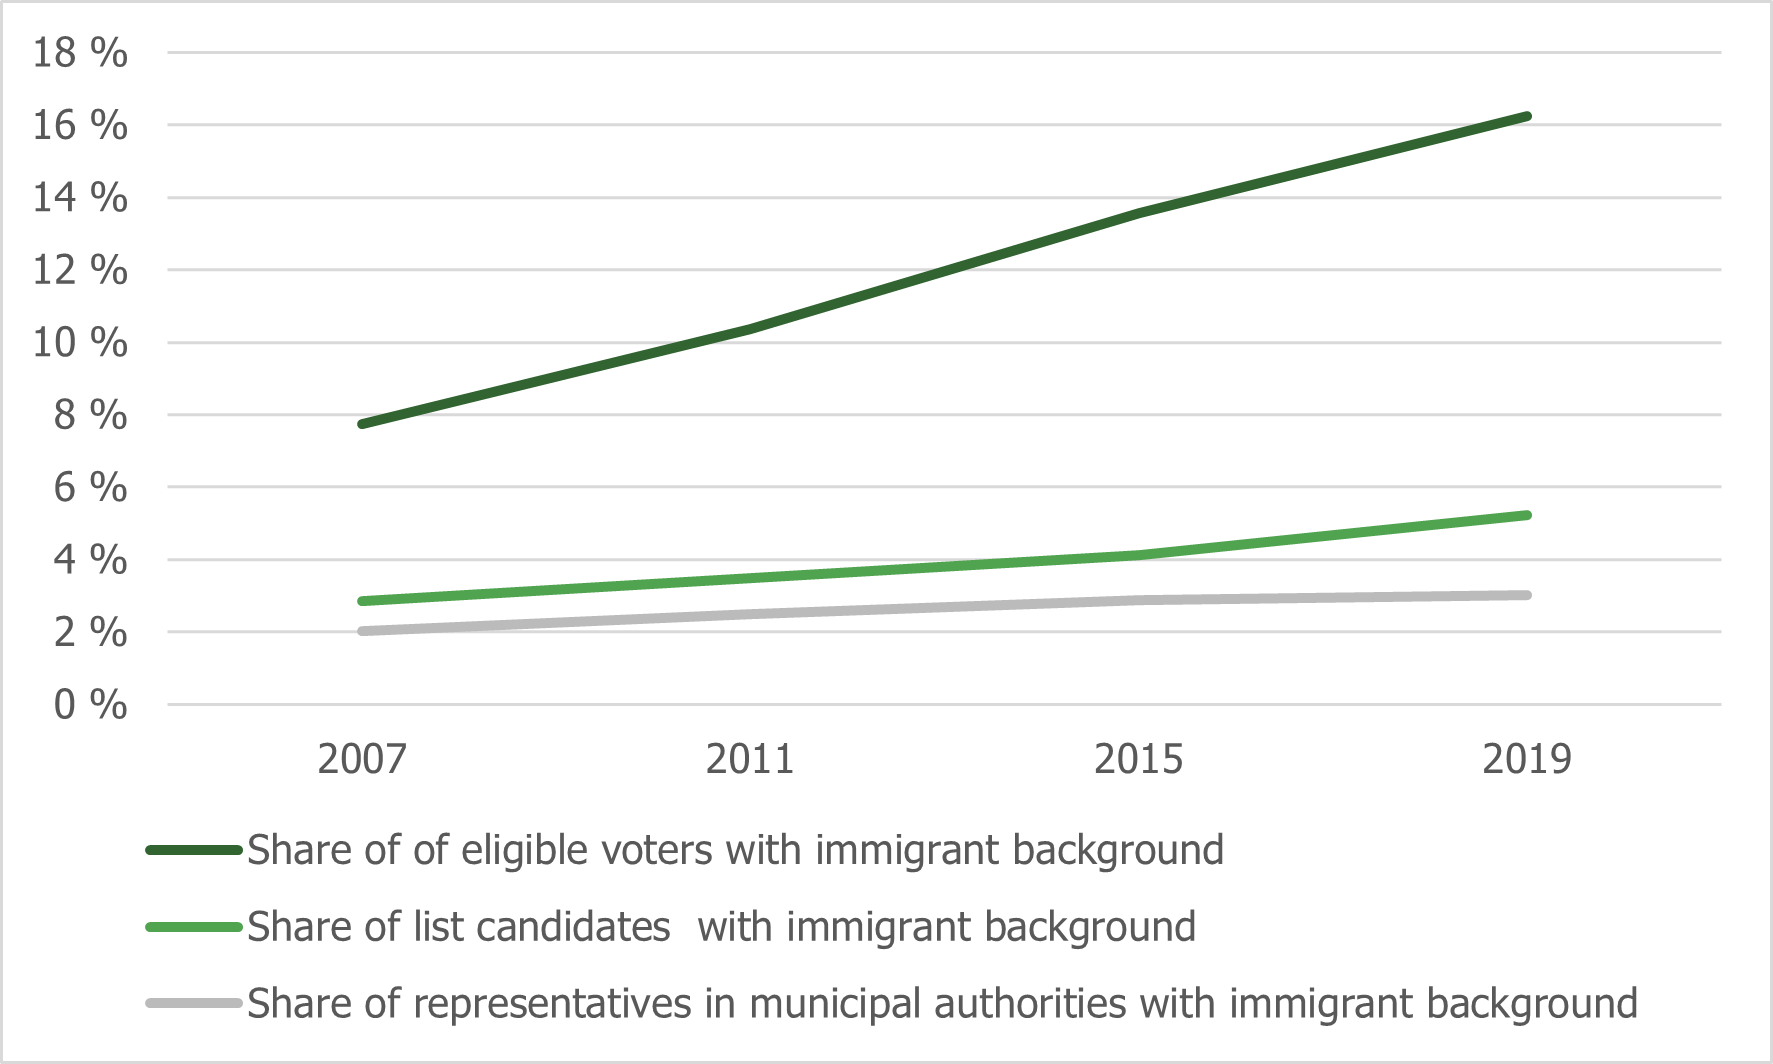
Immigrants are underrepresented in politicsThe proportion of eligible voters with an immigrant background has grown in recent years, and underrepresentation in important political institutions has increased. In the municipal elections, just over 680,000 people with an immigrant background had the right to vote, around 2,800 ran for election, and just under 300 won a seat on a municipal council. The proportion of representatives has risen minimally since 2007, and there has been a slight increase in the proportion of candidates.
Figure 4.12: People with an immigrant background as a proportion of eligible voters, list candidates and representatives in municipal elections, 2007–2019 (Statistics Norway – SSB, 2019i, 2019h, 2019g, 2019k)
Increasingly positive, but sharply divided, attitudes towards immigrants
Several surveys are conducted regularly in Norway on attitudes towards immigrants and immigration. One of these is Statistics Norway’s survey of the population’s attitudes towards immigrants and immigration, which has been carried out annually since 2002. The results show that over time there has been an overall increase in positive attitudes towards immigrants. At the same time, some annual variations have been found, largely linked to specific events and economic fluctuations in society. For example, more critical attitudes were registered in the 2016 survey, following the large influx of Syrian refugees into Norway. In recent years, however, the surveys have shown increasingly immigrant-positive attitudes, a trend that continued in 2020 (Strøm & Molstad, 2020).
Figure 4.13: Percentage who agree completely or partially and disagree completely or partially with two statements. 2002–2020 (Statistics Norway – SSB, 2020d)
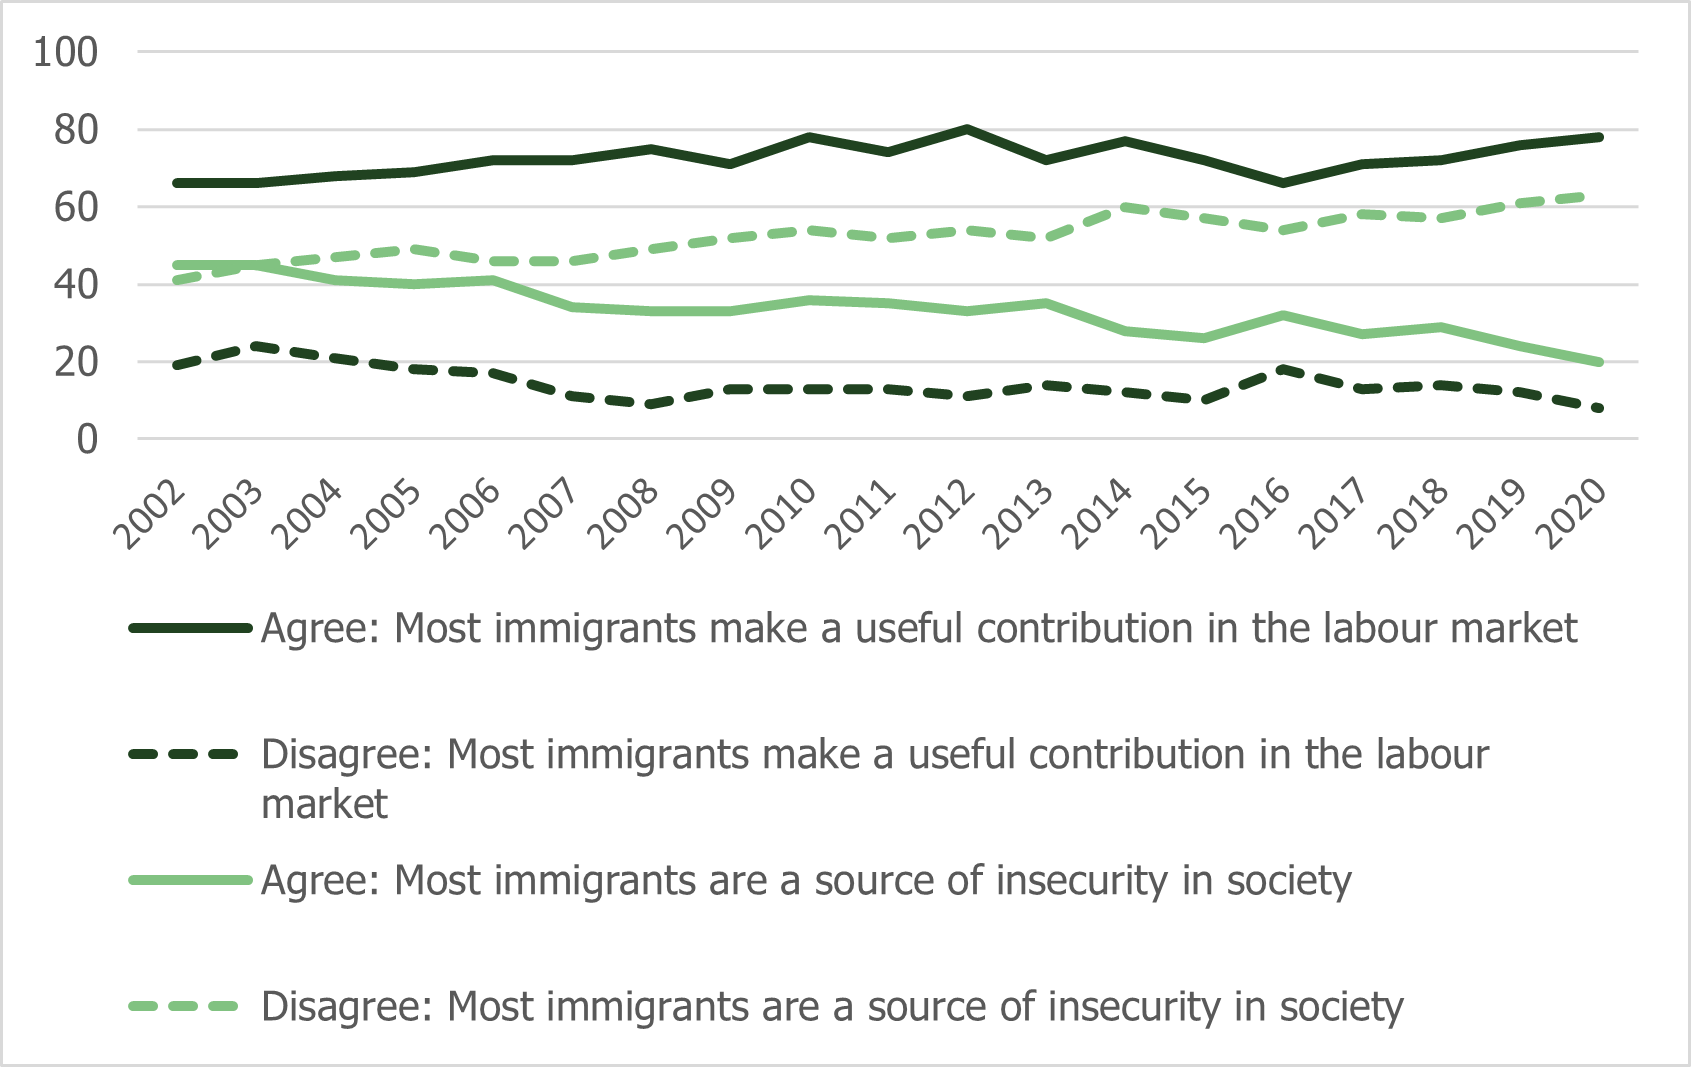
A growing number of people agree with positive statements about immigrants in the survey. For example, the share of respondents who agreed with the statement “most immigrants make a useful contribution on the labour market” increased from 66 per cent in 2002 to 78 per cent in 2020, while the share of respondents who disagreed decreased by 11 percentage points in the same period. This is demonstrated in Figure 4.13.
Nevertheless, the trend towards more immigrant-positive attitudes is most evident in the negatively worded statements. In 2002, 45 per cent of respondents agreed that “most immigrants are a source of insecurity in society”. In 2020, this share had dropped to 20 per cent. By contrast, 22 percentage points more people disagreed with this statement in 2020 (Figure 4.13).
The “Integration Barometer” also finds more positive attitudes in certain areas. At the same time, attitudes towards immigrants vary according to the immigrants’ reason for immigration, national background and religion. For example, in 2019, 52 per cent of respondents responded that Islamic values are incompatible with fundamental values of Norwegian society. When asked about Christianity, Judaism and Buddhism, 8, 17 and 22 per cent, respectively, of the respondents answered that the values of these religions are incompatible with fundamental values of Norwegian society
While four in ten respondents hold that immigration is good for Norway, only two in ten find that integration is working well. Almost half of the respondents stated that integration in Norway is going fairly badly or very badly. Around 60 per cent believe that the integration problems are due to cultural differences. A similar proportion also indicate discrimination as an obstacle to integration.
The results from both surveys indicate that attitudes towards immigration are related to different characteristics of the respondents. For example, women, young people and highly educated people are more positive towards immigration than middle-aged people and people with low maximum educational attainment.
4.10 Greater awareness about discrimination of immigrants
Research shows that 22 per cent of immigrants and 27 per cent of people born in Norway to immigrant parents state that they have experienced differential treatment due to their immigrant background (Egge-Hoveid, 2018; Hamre, 2017). Around a fifth of immigrants in employment or education experienced discrimination at the workplace or educational institution, and 28 per cent experienced discrimination due to their immigrant background in the hiring process .
Perceived differential treatment is subjective and does not necessarily reflect the other party’s intentions. Several studies nevertheless support the figures on perceived discrimination from Vrålstad and Wiggen (2017). Experiments using fictitious applications in recruitment processes can isolate the significance of a single factor, such as whether the applicant has a Pakistani name or a Norwegian name. A study of this nature showed that there was a 25 percentage point smaller chance of being called in for a job interview for applicants with a Pakistani name, with otherwise identical qualifications (Midtbøen, 2015). Another study showed that the probability of being called in for an interview was even lower if the applicant stated that they are Muslim (Larsen & Stasio, 2019).
When it comes to discrimination in other areas, 6 per cent had experienced differential treatment related to their immigrant background in contact with the health services or public institutions. Slightly fewer (3 per cent) reported that they had experienced discrimination in contact with the police. A similar proportion had experienced discrimination in connection with buying or renting a home.
LGBTIQ+ people with an immigrant background in Norway are vulnerable to multiple forms of discrimination and marginalisation, due to both their immigrant background and because they do not conform with gender and/or sexuality norms. Nordland Research Institute (2018) points out that people from a country that does not recognise same-sex love tend to experience environments with people with the same country background as exclusionary. According to the report, many of these people experience more discrimination from society in general due to their immigrant background than their gender identity and/or sexual orientation. Transgender people and people with a short period of residence in Norway are particularly susceptible to mental health problems and attempted suicide. The survey asked several specific questions about discrimination in the labour market, which are shown in Figure 4.14.
Figure 4.14: Discrimination in the workplace (Eggebø et al., 2020)
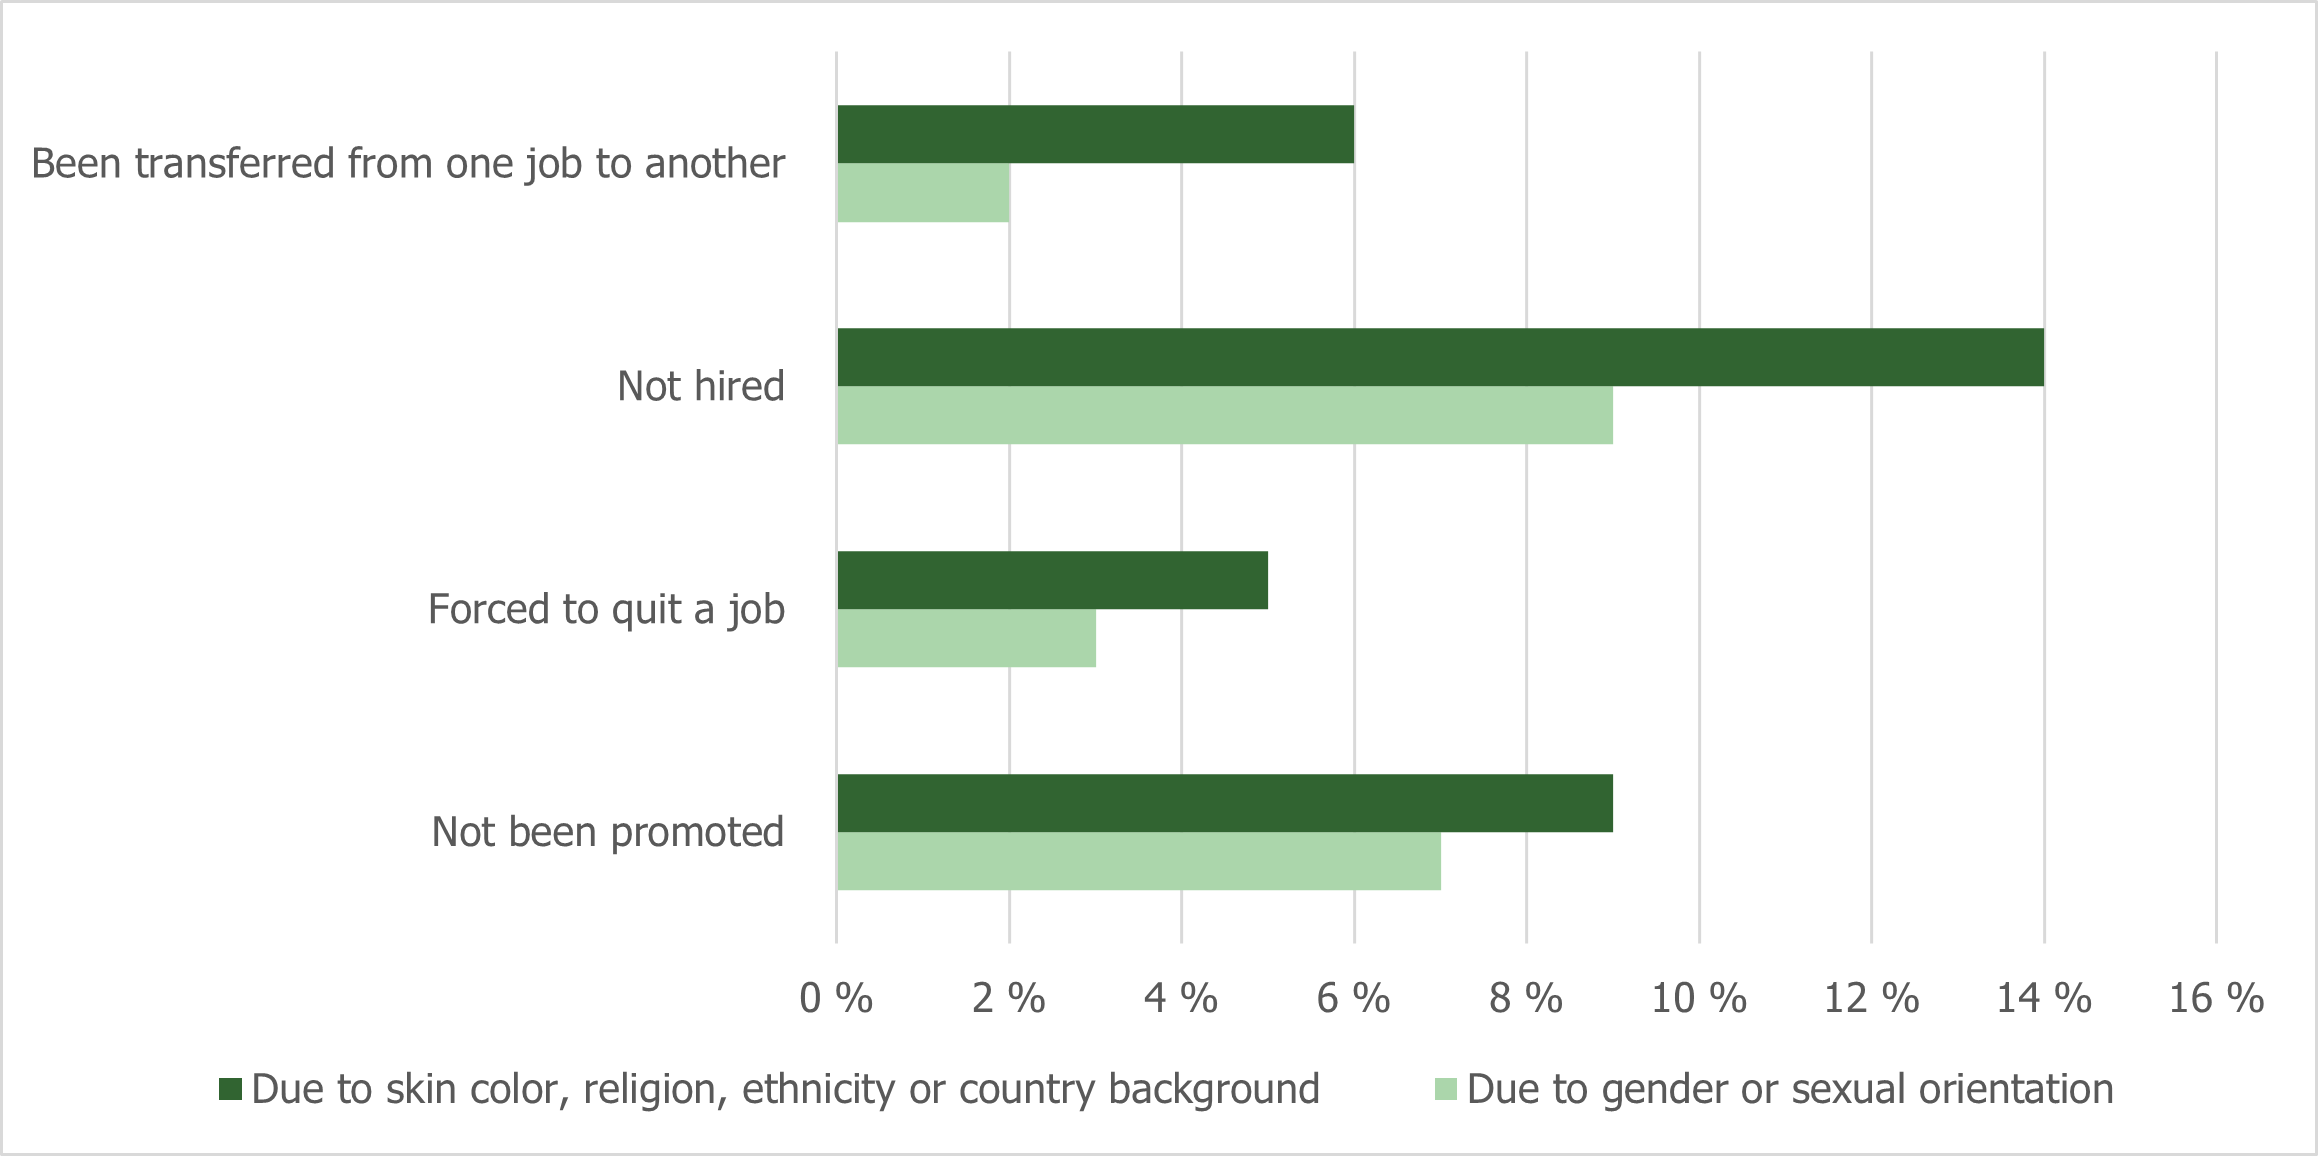
Eggebø et al. (2020) presents findings from a survey on living conditions among LGBTIQ+ people with an immigrant background in Norway. Using an intersectional perspective, they found that more than half of the respondents reported negative comments or actions related to their gender identity or sexual orientation, and slightly more related to their reason for immigration. Figure 4.14 shows the respondents’ answers to the questions “Have you experienced the following in a workplace in the last five years because you do not conform with gender and/or sexuality norms?” and “Have you experienced the following in a workplace in Norway due to your skin colour, ethnicity, religion or national background?”
In the national Integration Barometer survey, people in Norway are asked, among other things, whether they believe that discrimination against immigrants occurs. In 2019, almost a third of the respondents (32 per cent) stated that they believe that discrimination occurs to a great extent. This was a threefold increase compared with 2013, when 9 per cent answered the same. In addition, more than half of the respondents in 2019 stated that discrimination occurs “to some extent”. In other words, there is a growing and relatively widespread belief that immigrants are discriminated against (Brekke et al., 2020).
The findings from the Norwegian Integration Barometer show that discrimination is considered a barrier to integration. In 2019, six in ten respondents stated that the integration problems are largely due to immigrants being subjected to discrimination (Brekke et al., 2020).