Work and finances
Participation in the labour market is important for inclusion and integration. Working promotes independence, self-realisation and network building. In addition, it provides an increased sense of belonging to society, counteracts poverty, and levels out inequalities. The goal of high employment among immigrants is also of socioeconomic significance and is a prerequisite for the Norwegian welfare state model in the long term (Official Norwegian Report – NOU, 2021:2). A main objective of the Norwegian government’s integration strategy is therefore to ensure that more immigrants gain a firm, stable foothold in the labour market. The strategy underlines that in order to achieve this, immigrants who need it must be given more opportunities to acquire formal qualifications within the framework of the introduction programme. The new Integration Act is intended to contribute to this, among other things.
Norwegian society is built on an egalitarian model where the goal is small social differences (white paper Report no. 13 to the Storting, 2018–2019). Major differences in living standards between immigrants and the rest of the population can hinder integration. Levelling out differences in living standards is therefore an important goal in Norway’s integration policy. The main way to achieve this is through labour force participation and economic self-sufficiency. Many immigrants work in temporary, involuntary part-time and low income positions. It will therefore be useful to monitor developments in income factors in addition to statistics on employment.
Newly arrived refugees have weaker participation in the labour market
The average employment rate among immigrants (aged 20–66 years) has increased from 64 per cent in 2015 to 65.4 per cent in 2020. At the same time, this proportion is lower than among the rest of the population. In 2020, employment among the rest of the population was 78 per cent. Behind the lower average employment rate among immigrants are significant differences between groups with different lengths of residence, sex, reason for immigration, and maximum educational attainment.
Labour immigrants often come to Norway because they have expertise that is in demand on the Norwegian labour market. The employment rate is therefore high among labour immigrants, regardless of their length of residence, and approximately on par with the rest of the population. It takes longer for refugees and reunified family members to acquire relevant skills and get out into work. Most people in this group participate in the introduction programme during the first few years after they settle in a municipality.
Figure 3.1: Employment rate, broken down by length of period of residence and reason for immigration. 2019 (Statistics Norway – SSB, 2019j)
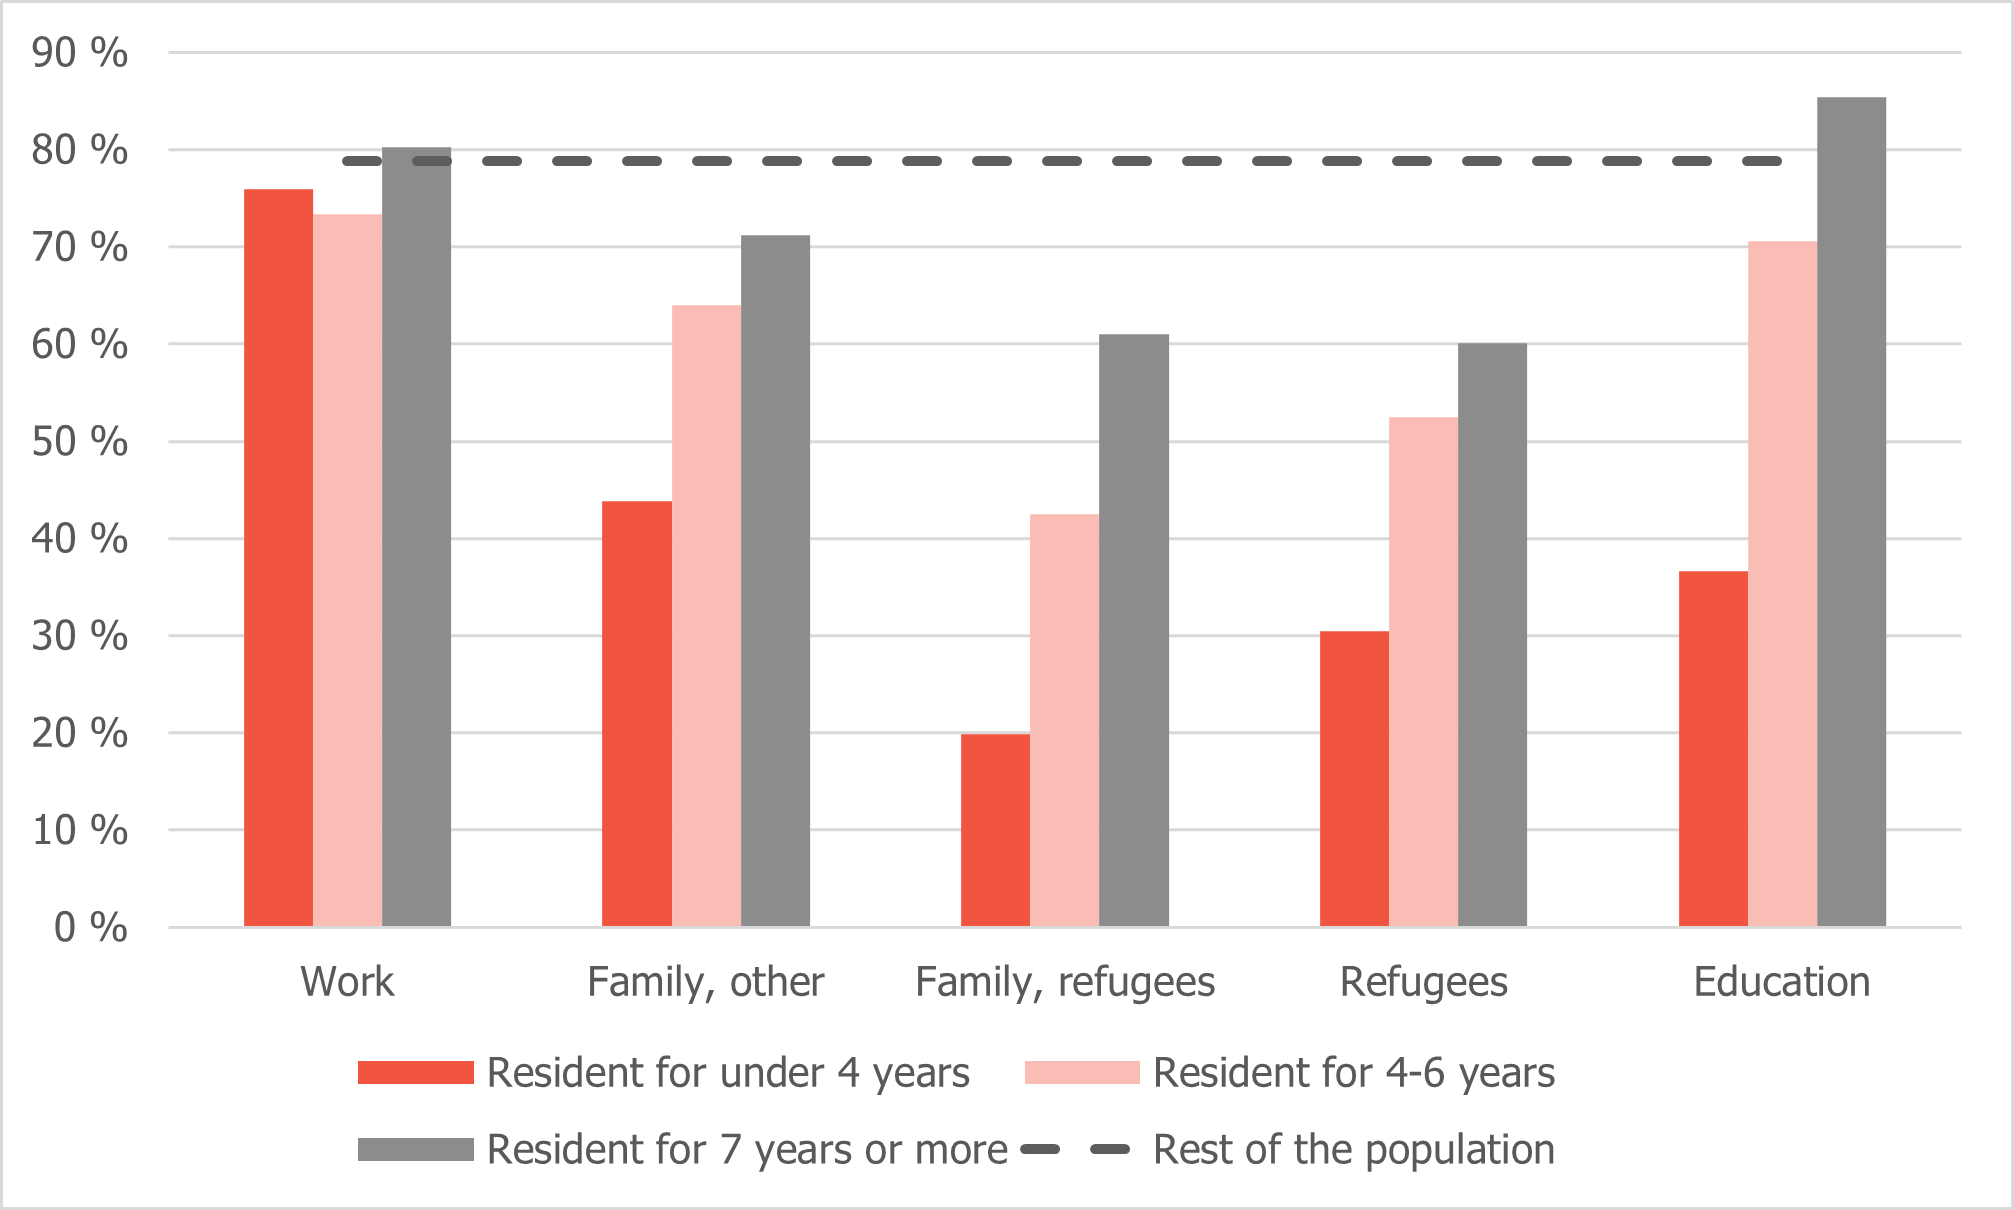
The proportion of refugees who have lived in Norway for more than six years that are in work was twice as high as for those with a shorter period of residence, at 60 versus 31 per cent. For reunified family members, the proportion was three times as high after six years (61 versus 20 per cent). At the same time, research (Bratsberg et al., 2016, 2017; Røed et al., 2019) indicates that after this rapid increase during the first six to eight years after settlement, the proportion of people in work stagnates among women and falls among men. In addition,employment does not increase with length of period of residence to the same extent in all groups of refugees. For example, male newly arrived refugees start working more quickly than their female counterparts (Olsen & Askvik, 2021).
A larger proportion of immigrants are employed in part-time positions than the rest of the population, and this applies especially to refugees. The difference in the proportion in full-time work between refugees and employees in the population as a whole must be seen in the context of, among other things, the occupations in which they work. Refugees are overrepresented in occupations where part-time work is prevalent, such as sales and service occupations, cleaning, care work, etc. For example, a massive 51 per cent were employed in sales and service occupations in 2019. In 2019, 52 per cent of refugee women were full-time employees, compared with 63.2 per cent for female workers as a whole. Among men, the proportions in full-time work were 70.7 and 84.5 per cent, respectively (Olsen & Askvik, 2021).
Immigrants from country group 2 are also more frequently employed in temporary positions. Although the share of temporary employees in this group has decreased since 2012, it was still twice as high as among the rest of the population, at 13 versus 7 per cent (Statistics Norway – SSB, 2020b).
Higher employment among people born in Norway to immigrant parents
As described in chapter 2 on demographics, most people born in Norway to immigrant parents are still relatively young – indeed three-quarters are under the age of 18. Nevertheless, it is interesting to monitor this group’s participation in the labour market, compared with immigrants and the rest of the population.
Figure 3.2 shows that 70 per cent of the people born in Norway to immigrant parents were in employment in 2020. This is higher than the employment rate among immigrants, but lower than among the rest of the population. In the population without an immigrant background, 78 per cent were in employment.
Figure 3.2: Employment rate, broken down by immigrant category and sex. (Statistics Norway – SSB, 2020j)
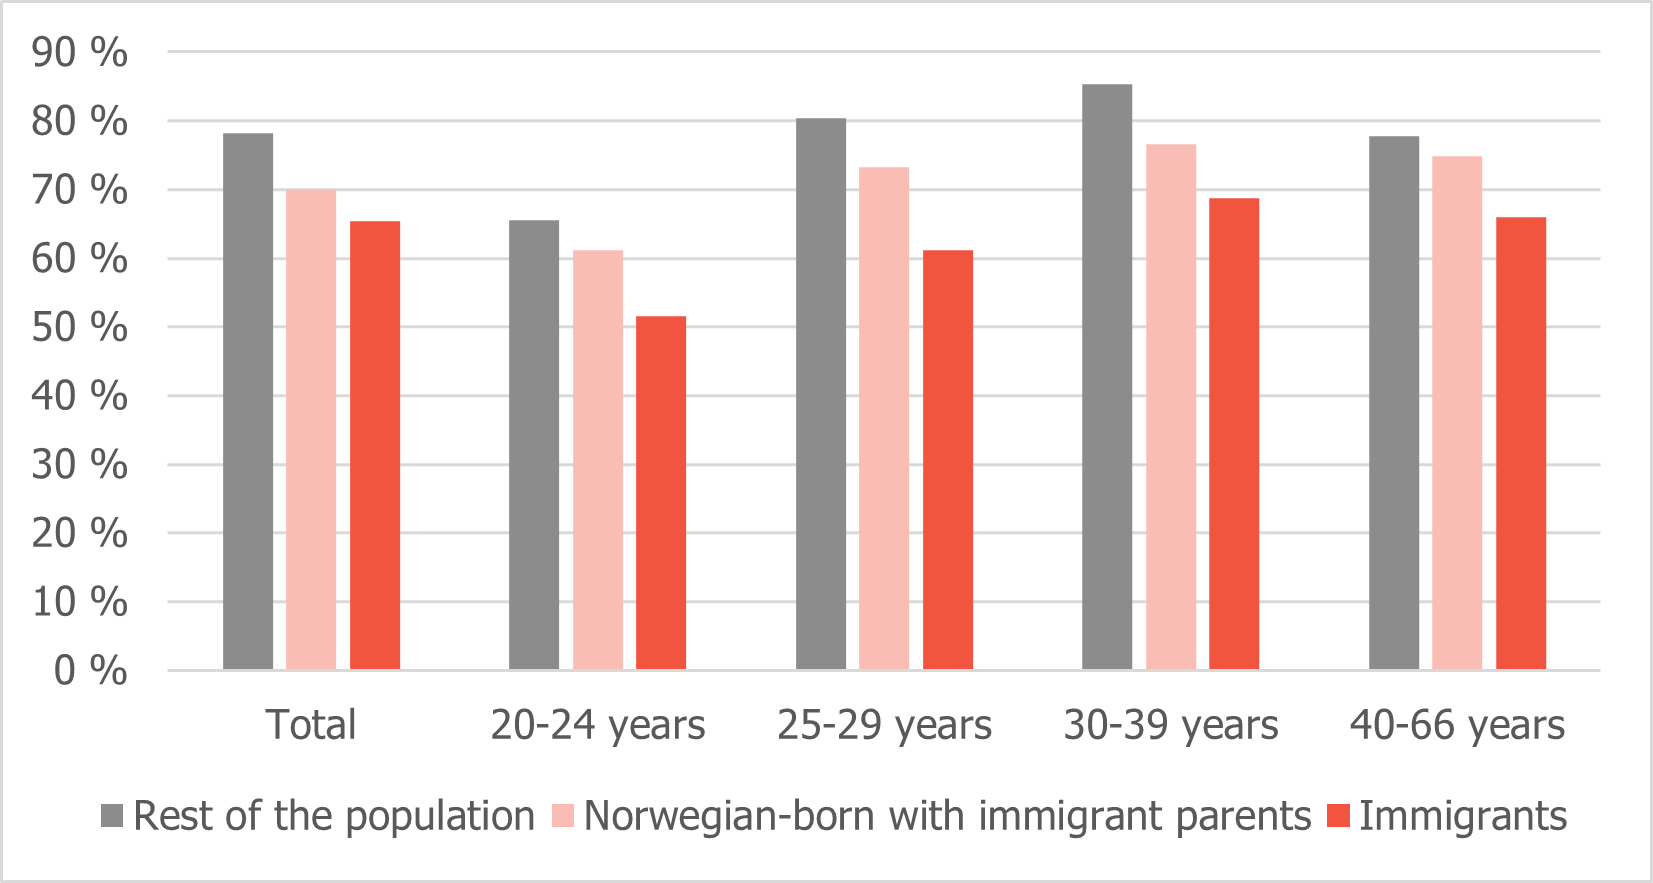
At the same time, labour force participation among people born in Norway to immigrant parents varies according to the parents’ national background. Young people (aged 25–39 years) born in Norway to immigrant parents from India and Vietnam have a very high level of labour force participation, on par with, or slightly higher than, their peers without an immigrant background. This applies to both sexes. Labour force participation among Norwegian-born women and men aged 25–39 years with immigrant parents from Turkey, Pakistan, Chile and Morocco is somewhat weaker, measured in this way. This group is clearly below the level of their peers without an immigrant background (Kirkeberg et al., 2019).
Immigrants’ labour force participation during the pandemic
Figures from Statistics Norway’s register-based employment statistics show that immigrants in the labour market were more severely affected by the restrictions in connection with the COVID-19 pandemic than the rest of the population. Between November 2019 and November 2020, the proportion of immigrants in employment decreased by 1.9 percentage points, compared with 0.7 percentage points among the rest
of the population (Figure 3.3).
Figure 3.3: Employed persons aged 20–66 years (per cent), broken down by national background. 2019 and 2020 (Statistics Norway – SSB, 2020i)
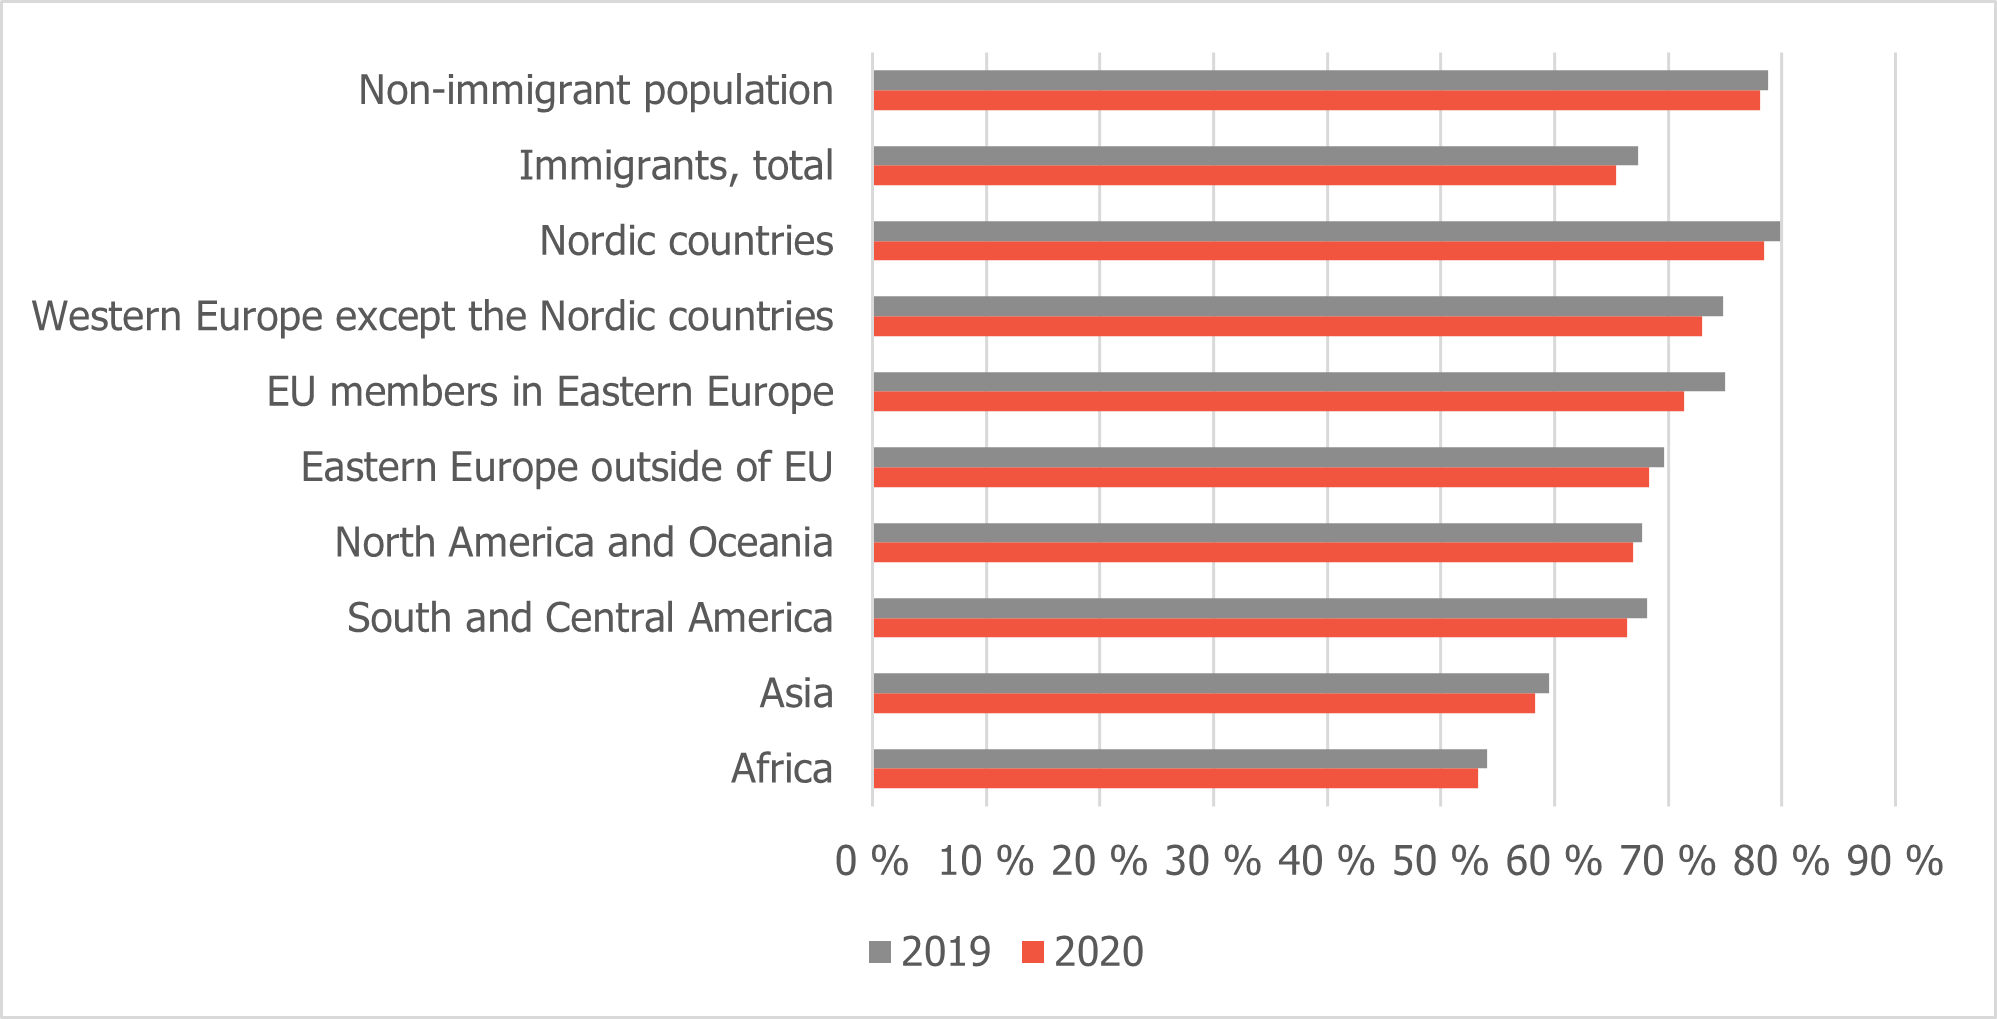
The decline in employment among immigrants must be seen in the context of employment patterns in this group. Immigrants are strongly overrepresented in the industries that were hardest hit by the COVID-19 crisis in 2020. This applies in particular to industries such as hospitality (accommodation and food and beverage service), land transport of passengers, and business services, which together saw a 9.4 per cent reduction in the number of employees. A total of 22.7 per cent of immigrants were employed in these industries in 2019, compared with 6.7 per cent of the general population (Olsen, 2019).
Broken down by national background, immigrants from EU countries in Eastern Europe had the largest reduction in the proportion of employed persons, with a decline of 3.6 percentage points. Immigrants from Africa, North America and Oceania had the smallest decline: 0.8 percentage points in both groups (Olsen, 2019).
Immigrants are overrepresented among the unemployed and under-employed
An unemployed person is defined as a person who is capable of working, has tried to get a job and is available to start working, but has not been offered a job. Unemployment is more than three times higher among immigrants than the rest of the population. At the close of 2019, 5 per cent of immigrants were unemployed (measured as a percentage of the labour force), while the corresponding share for the rest of the population was 1.5 per cent. In 2020, the labour market was heavily impacted by the COVID-19 pandemic, with many employees being laid off and fewer vacancies. This resulted in a dramatic rise in unemployment in the fourth quarter of last year. Unemployment rose to 9.2 per cent among immigrants and to 2.7 per cent in the rest of the population (Olsen, 2021).
In addition to the unemployed, which are people seeking work, there are also a number of “underemployed” people, i.e. people working in part-time positions who would like to work more. Figures from Statistics Norway’s Labour Force Survey show that the proportion of underemployed people has been about twice as high among immigrants as among the rest of the population in recent years. In 2020, 21 per cent of all immigrants employed in part-time positions stated that they would like more contractual working hours, while the corresponding figure among part-time employees in the rest of the population was 11 per cent (Figure 3.4).
Figure 3.4: Underemployment, broken down by immigrant category. Per cent (Statistics Norway – SSB, 2020a)
Young immigrants are more li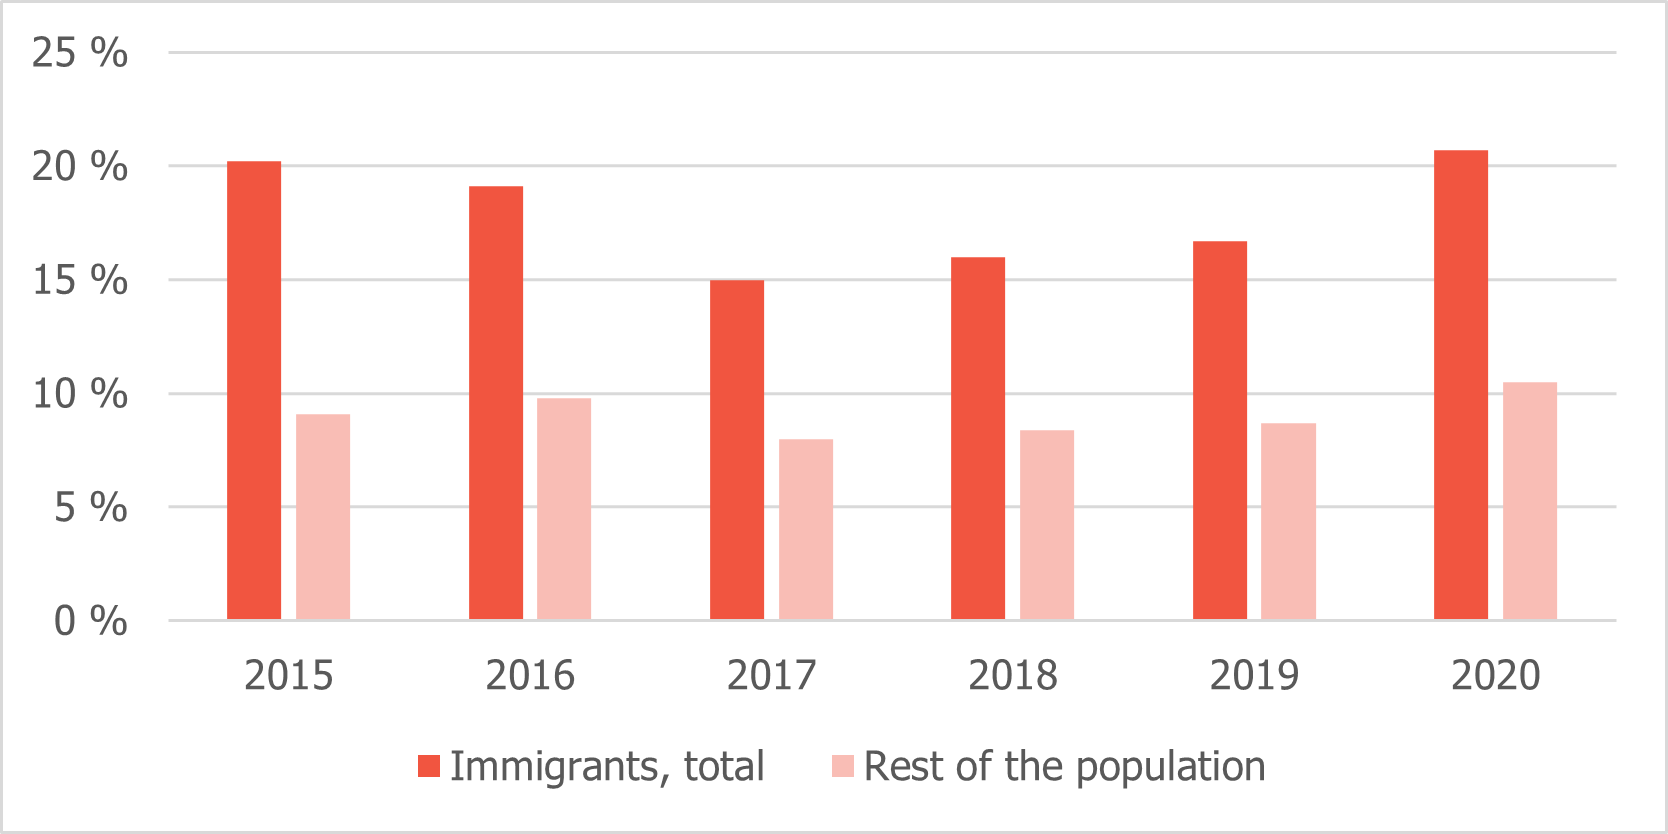 kely to end up outside work and education
Young people who are not in work, education or some form of employment scheme are often referred to as NEET . In Norway, there are relatively few young people with NEET status, compared with other European countries. In Norway, 6.6 per cent of young people aged between 15 and 29 years were NEET in 2020, while the EU average was 13.7 per cent (Eurostat, 2020).
Immigrants are more likely to end up in the NEET category than young people in the majority population. This is partly due to the fact that there are more immigrants with little education. Low educational attainment is the primary risk factor for NEET status among young people in Norway (OECD, 2018).
Figure 3.5: Young people aged 15–29 years not in employment, education or training (NEET). Per cent (Eurostat, 2020)
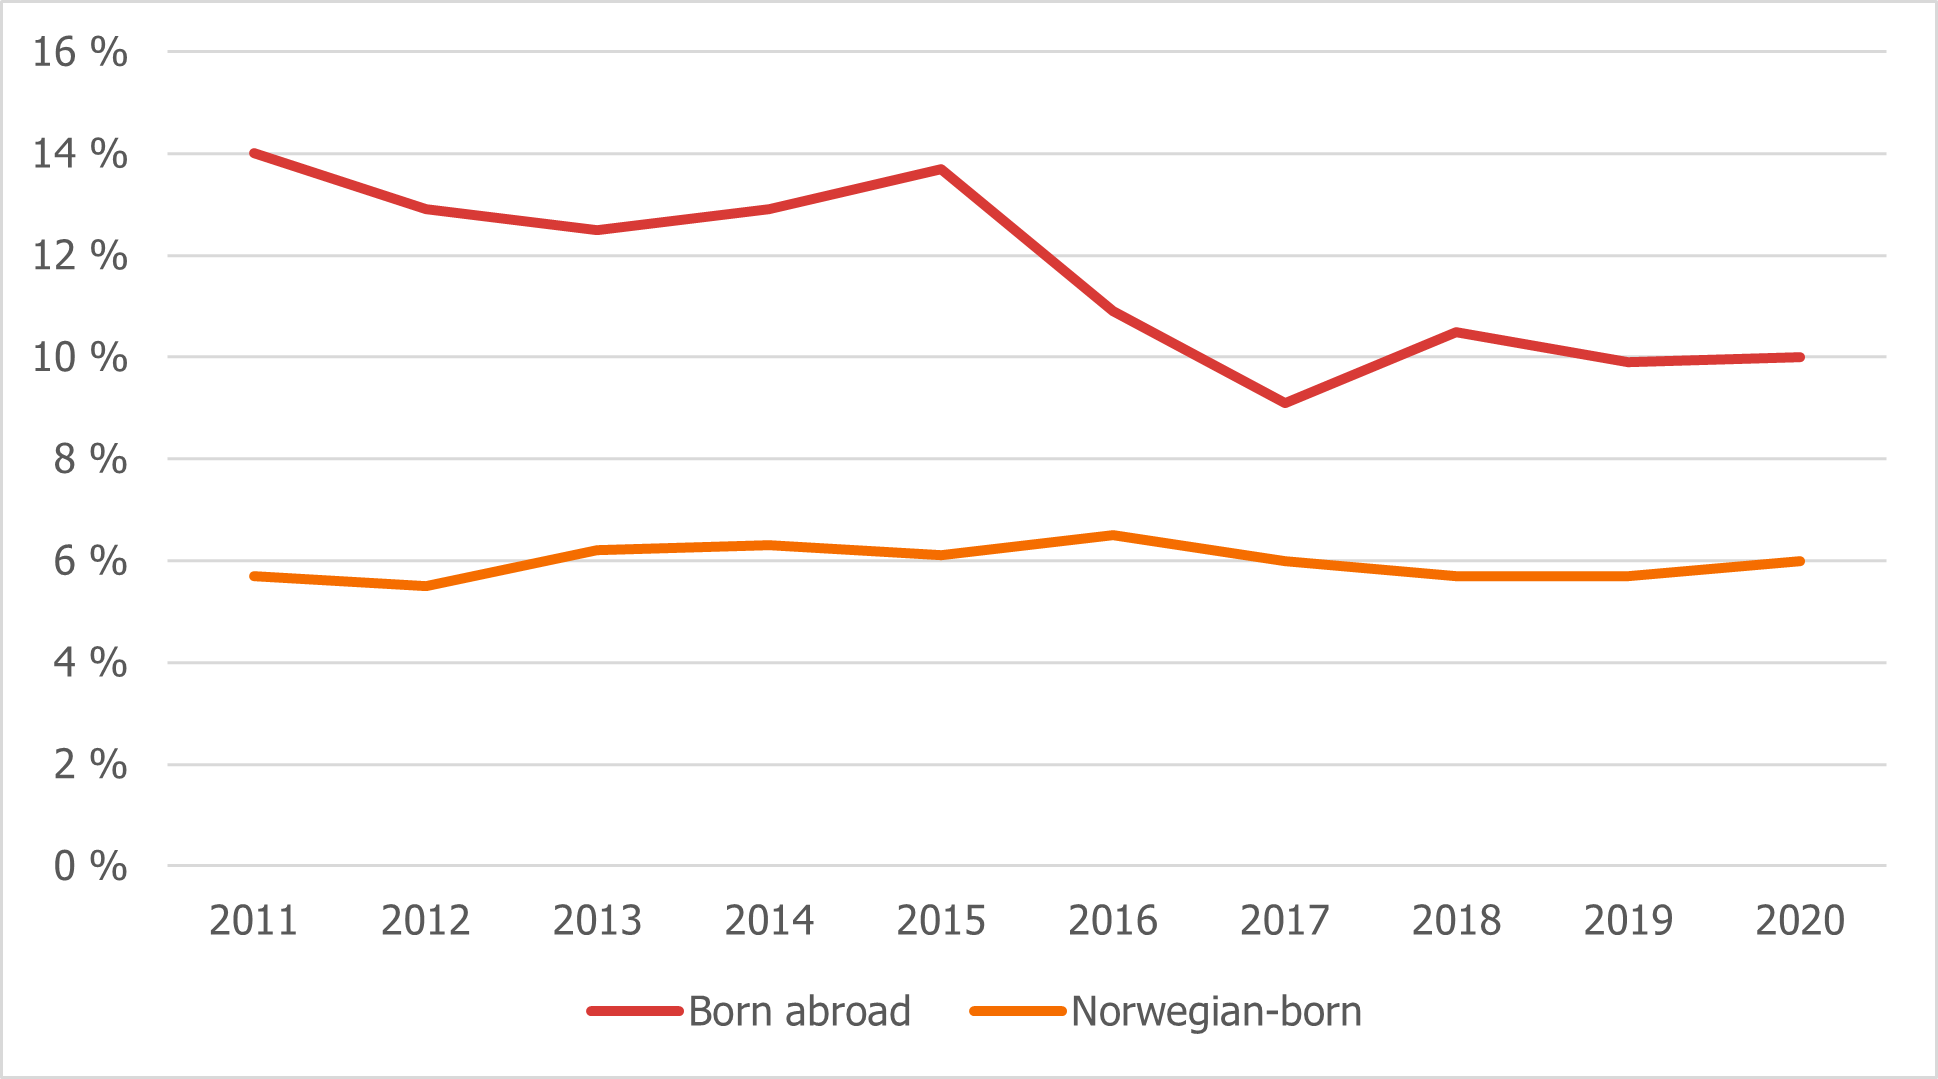
Figure 3.5 shows that the proportion of people not in employment, education or training was almost twice as high in 2020 among young people born abroad, compared with young people born in Norway , at 10 and 6 per cent, respectively (Eurostat, 2020). At the same time, the proportion of NEETs among people born outside Norway has decreased over the past ten years, while it has remained stable for the rest of the population in this age group. The difference in the proportion of young people not in employment, education or training between young people born in Norway and young people born abroad has decreased.
Immigrants have significantly lower income
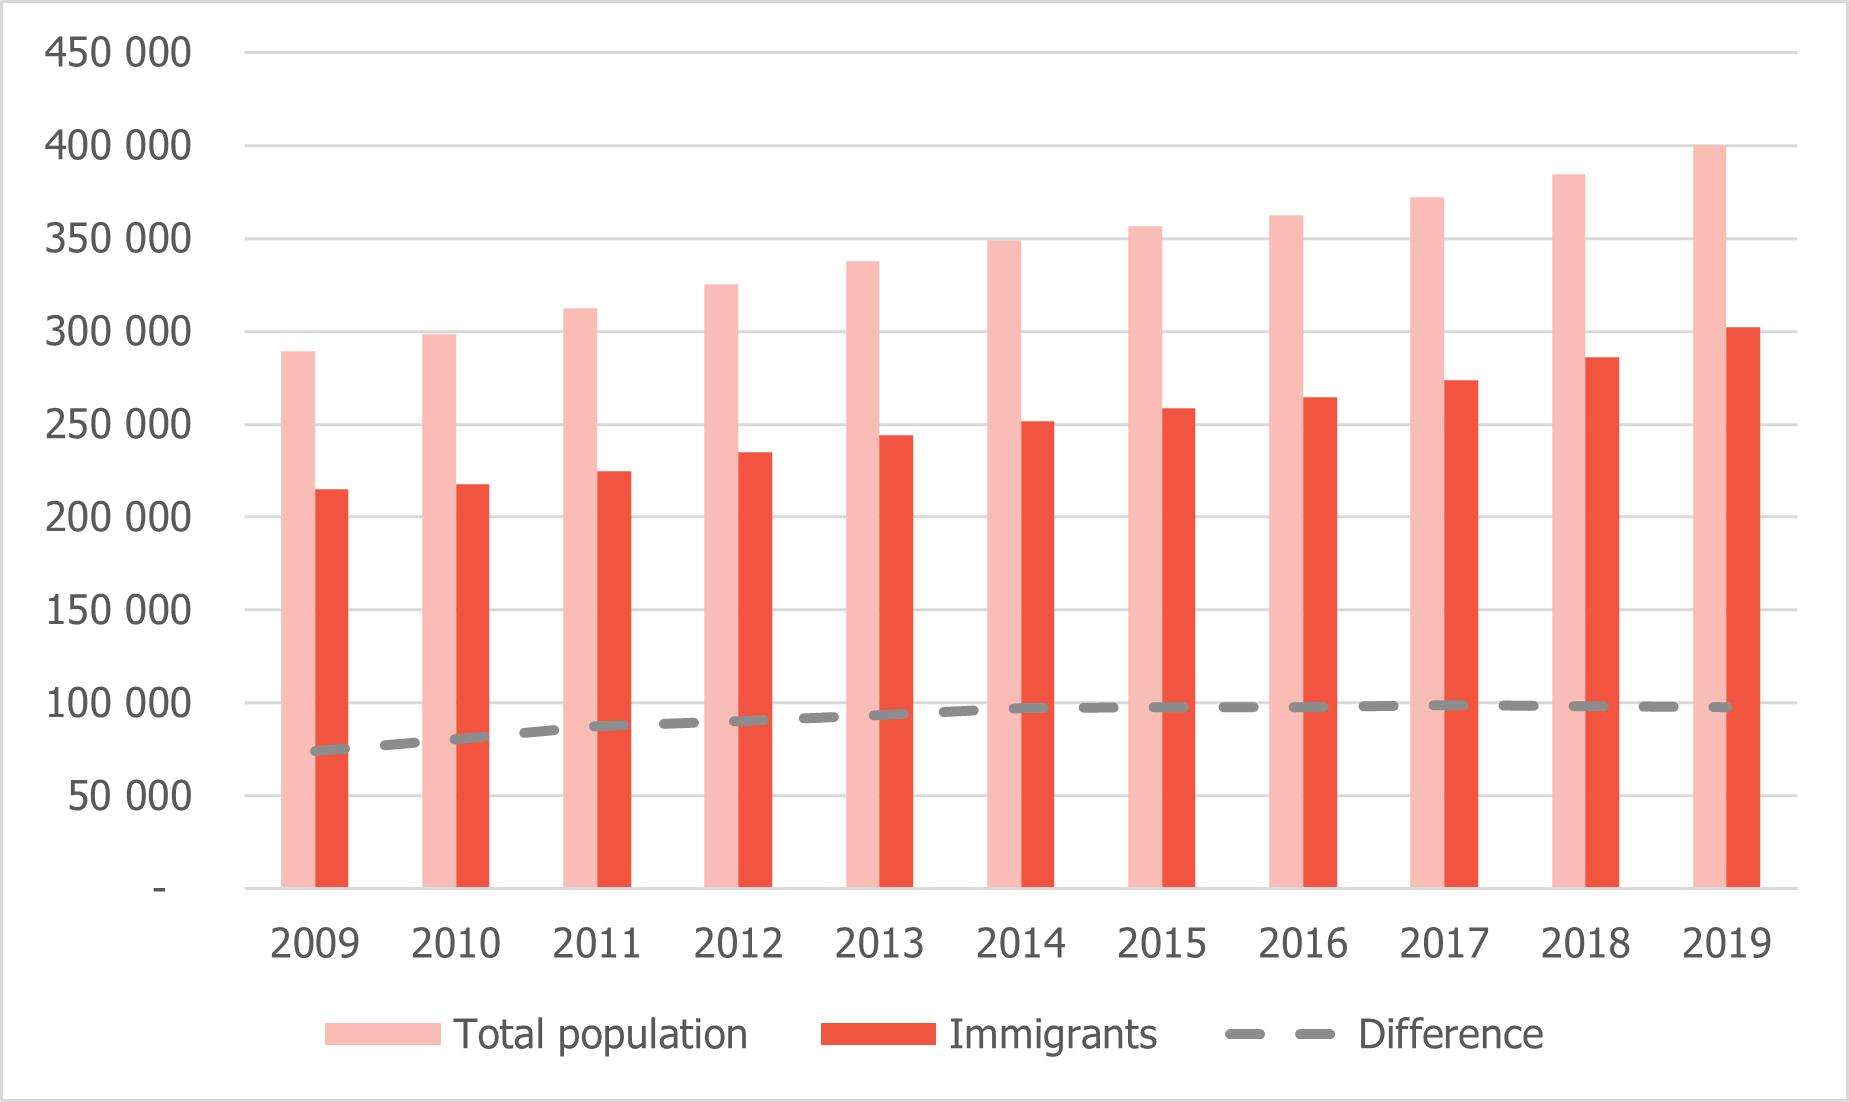
As a group, immigrants have a lower average income than the population as a whole. This difference amounted to approximately NOK 100,000 in 2019, and has remained relatively stable in recent years. Together, both immigrants and the population as a whole have had income growth between 2009 and 2019.
Figure 3.6: Median income after tax, the entire population and immigrants. (Statistics Norway – SSB, 2019e)
Income level is closely related to participation in employment. Immigrant groups with low employment rates (for example, immigrants with a short period of residence in Norway or with little education) are also at greater risk of falling below the low-income threshold.
One in four immigrants live in households with persistently low income
Low income is defined as income (after tax and equivalised for household size) that is below 60 per cent of the national median income. Persistently low income is defined as having a low income for a period of three years or more.
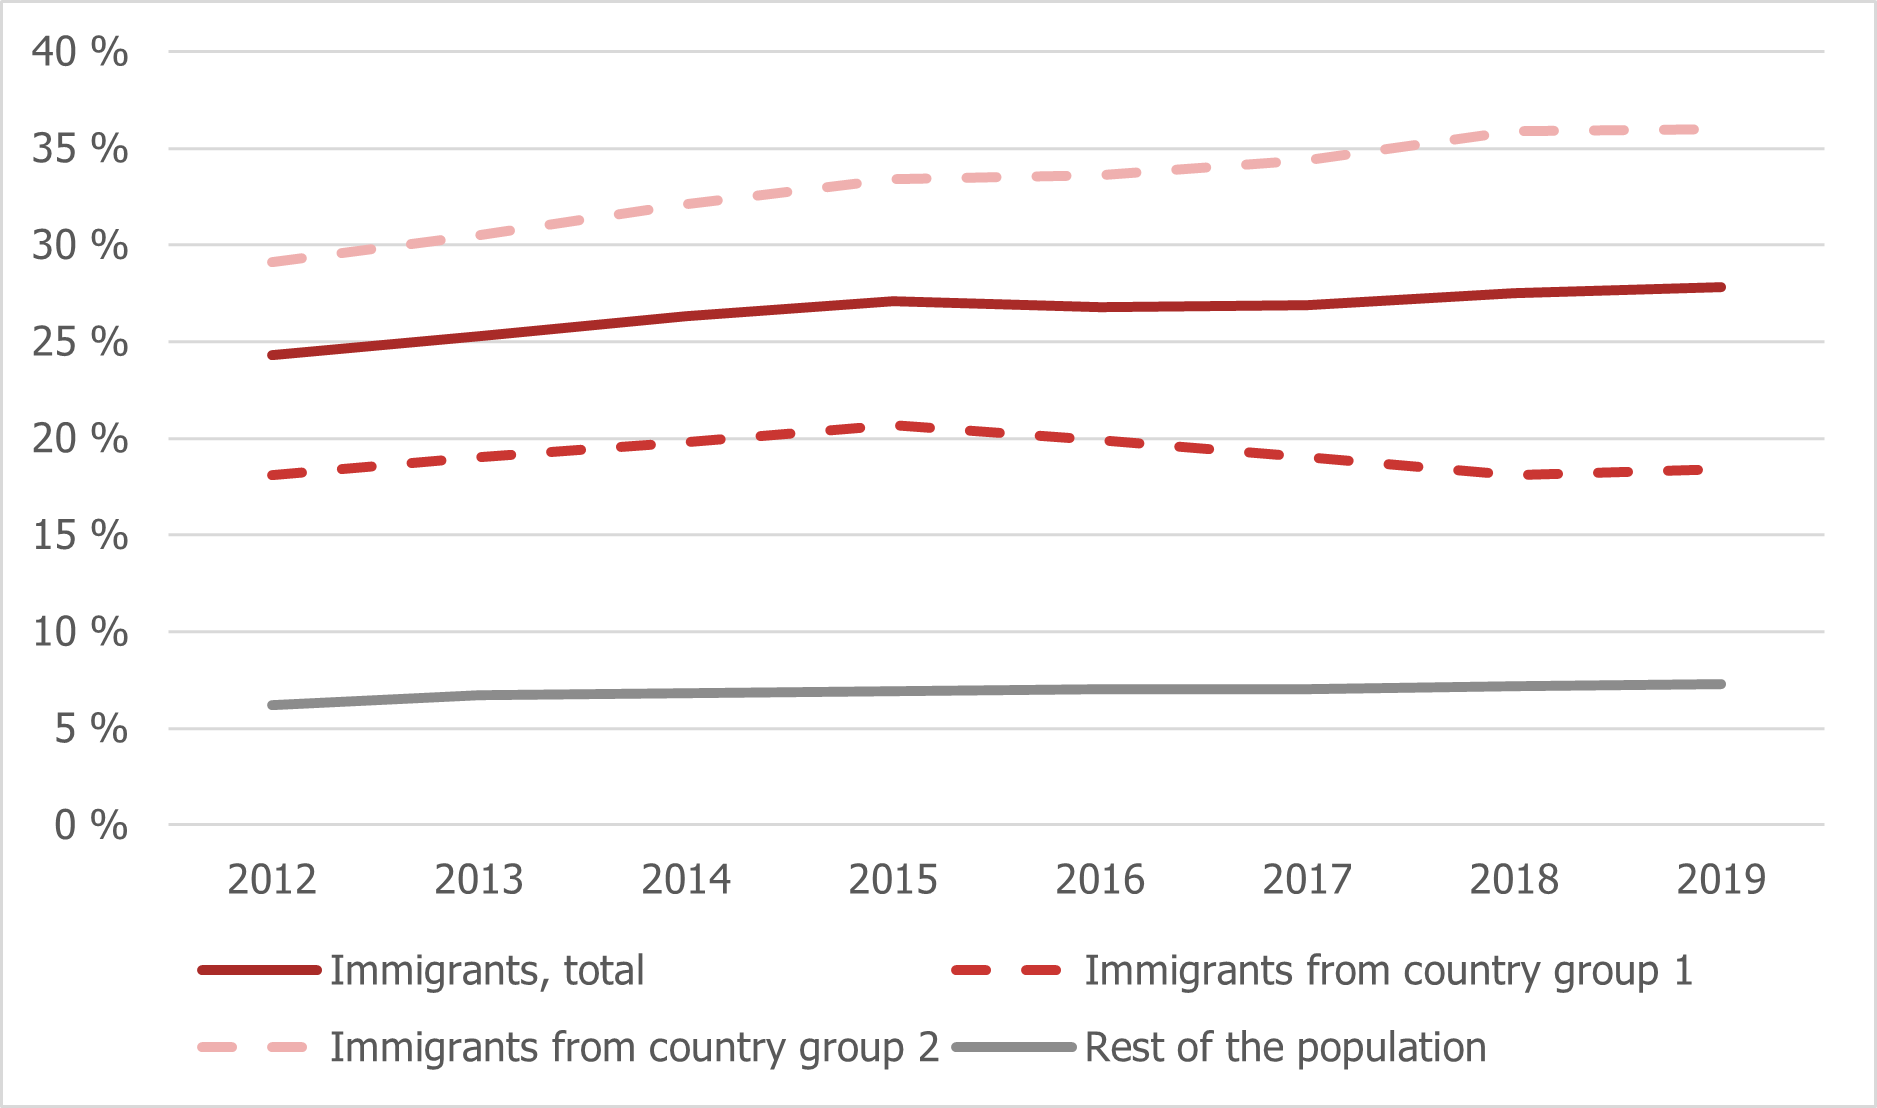
This applied to 28 per cent of immigrants in the period 2017–2019, compared with 7 per cent of the rest of the population. It is primarily immigrants from country group 2 that fall into this category. A massive 36 per cent of this group experienced persistently low income during the period, which is twice as high as among immigrants from country group 1.
Figure 3.7: Share with persistently low income 2010–2012 to 2017–2019, broken down by immigrant category.(IMDi, 2019b)
More than half of children in low-income households have an immigrant background
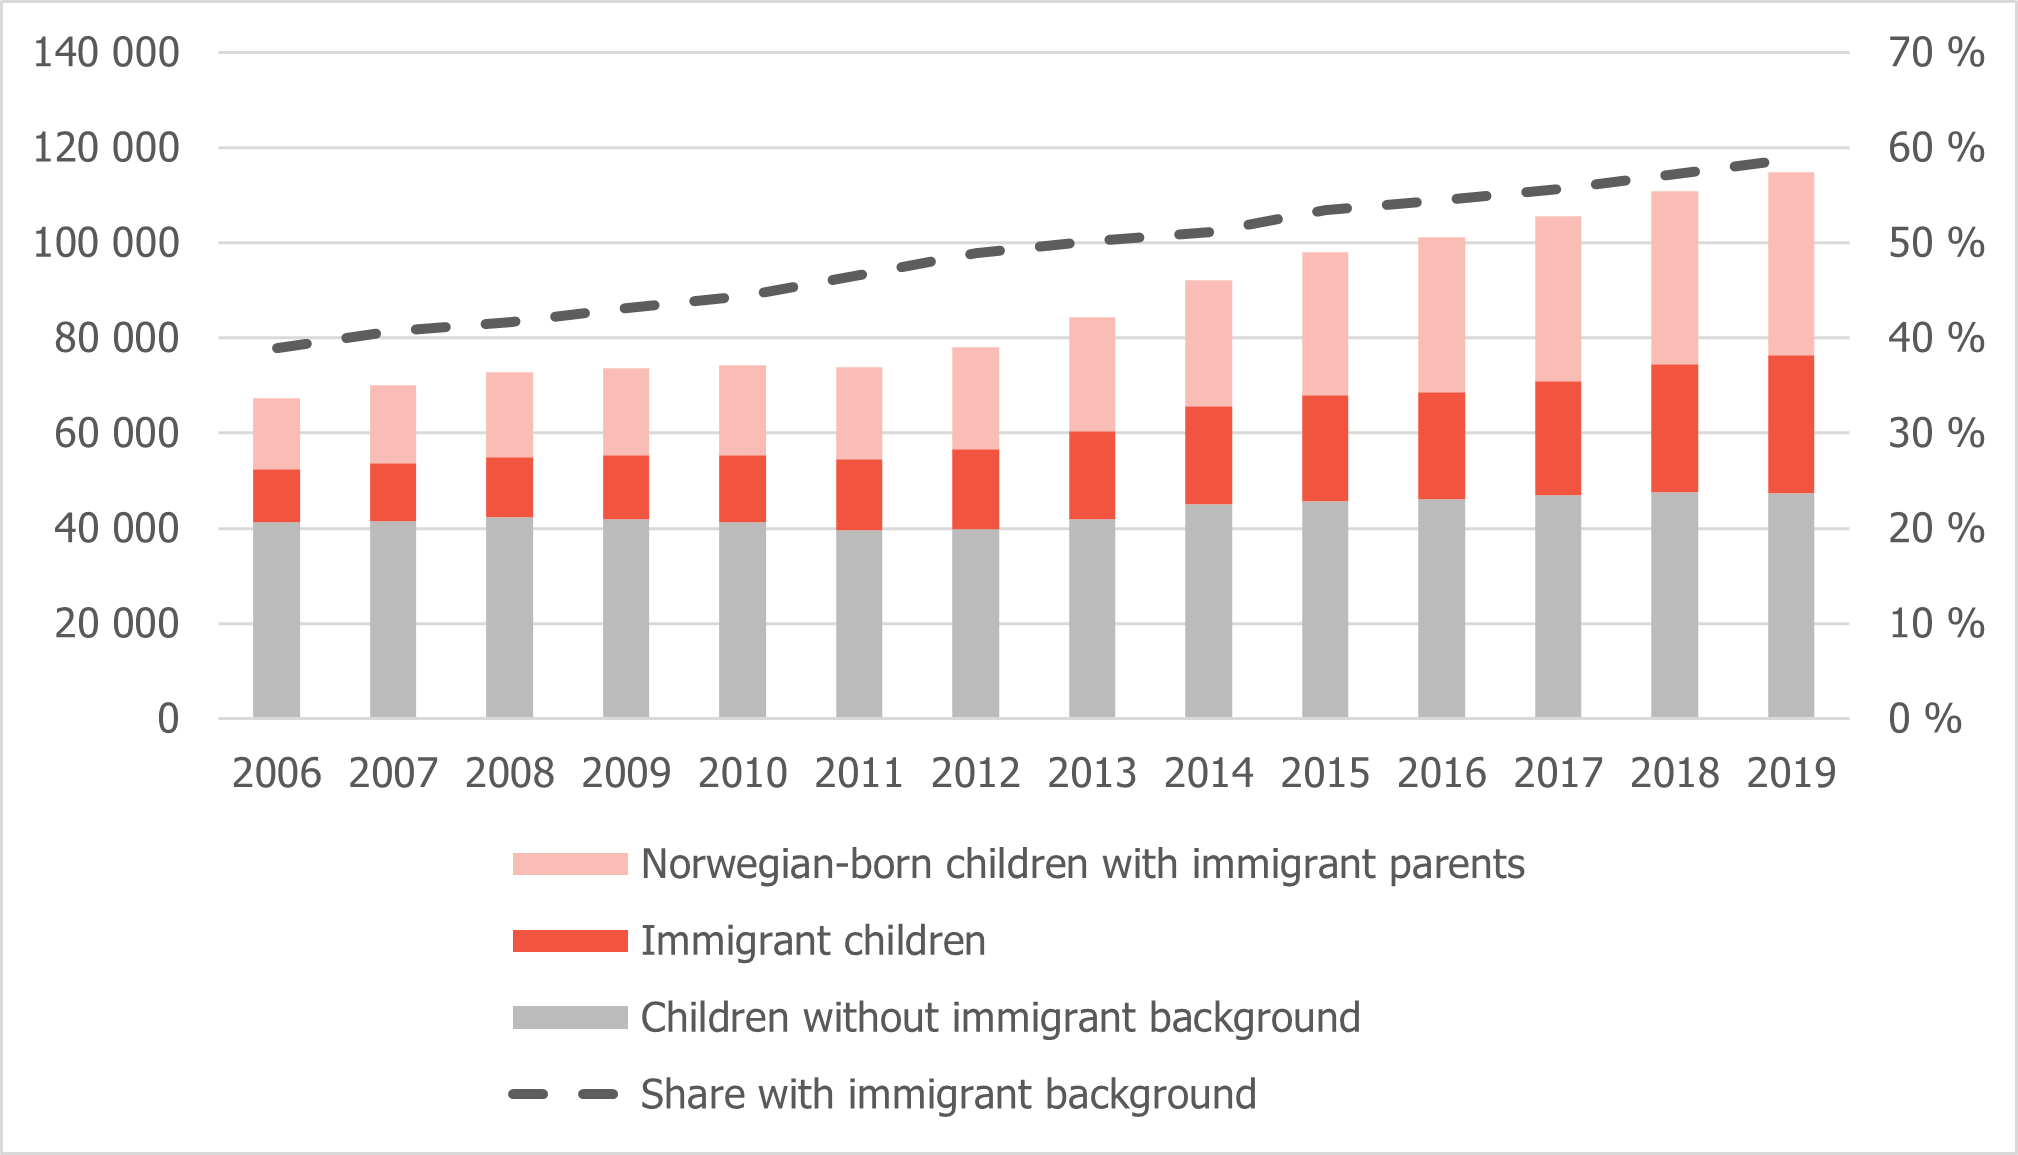
Children with an immigrant background are becoming increasingly overrepresented among children in households with a persistently low income. In 2019, 60 per cent of children in households with a persistently low income had an immigrant background. This figure was 39 per cent in 2006, as is illustrated in Figure 3.8
Figure 3.8: Children in households with a persistently low income, number and proportion with an immigrant background. NOK and per cent (Statistics Norway – SSB, 2019d)
There are clear patterns in the incidence of persistently low income among families with children according to their national background. Almost 90 per cent of children with a background from Syria, and almost 80 per cent of children with a background from Somalia were living in low-income families in 2019. By comparison, this applied to only 10 per cent of children in families with a background from India or Bosnia and Herzegovina (Epland & Normann, 2021).
There is a clear correlation between household size and how many occupationally active people there are in the household and persistently low income in families with children. This may explain some of the differences by national background described above.
Based on the available statistics, we cannot yet see what impact the COVID-19 pandemic has had on children in low-income families in 2020. Several studies from different countries indicate that the pandemic has exacerbated social inequalities, and that children in low-income families experienced greater economic uncertainty, psychological challenges, and poorer access to digital tools (Nøkleby et al., 2021). In December 2020, the Norwegian Labour and Welfare Administration (NAV) published a report suggesting that the COVID-19 pandemic may have resulted in poorer living conditions among the most vulnerable groups in Norway too (Lima et al., 2020).
Immigrants live in more cramped conditions than the rest of the population
While almost 90 per cent of the non-immigrant population own the property they live in, it is more common among immigrants to rent. In 2020, 61 per cent of immigrants from country group 1 and 57 per cent of immigrants from country group 2 lived in self-owned property (Normann, 2017). In other words, the difference between the country groups is small in this area. At the same time, there is considerable variation in the proportion within each of these country groups. For example, around 80 per cent of immigrants from Vietnam, Sri Lanka and Pakistan owned their own home in 2016, compared with only 20 per cent of immigrants from Somalia.
The differences in home ownership between the two country groups and the rest of the population have remained relatively stable since 2015.
There are a variety of possible reasons for the lower rate of home ownership among immigrants. Getting into the housing market often takes time and requires a sufficiently high income. As mentioned above, immigrants are overrepresented among low-income households. Immigrants with a longer period of residence in Norway tend, on average, to have a higher income. This is probably one of the reasons why the proportion of people who own a home rises with length of period of residence. Figure 3.9 shows that this is the case for all immigrants, irrespective of their reason for immigration.
Figure 3.9: Home ownership among immigrants, broken down by reason for immigration and length of period of residence. Per cent. 2016. (Statistics Norway – SSB, 2020e)
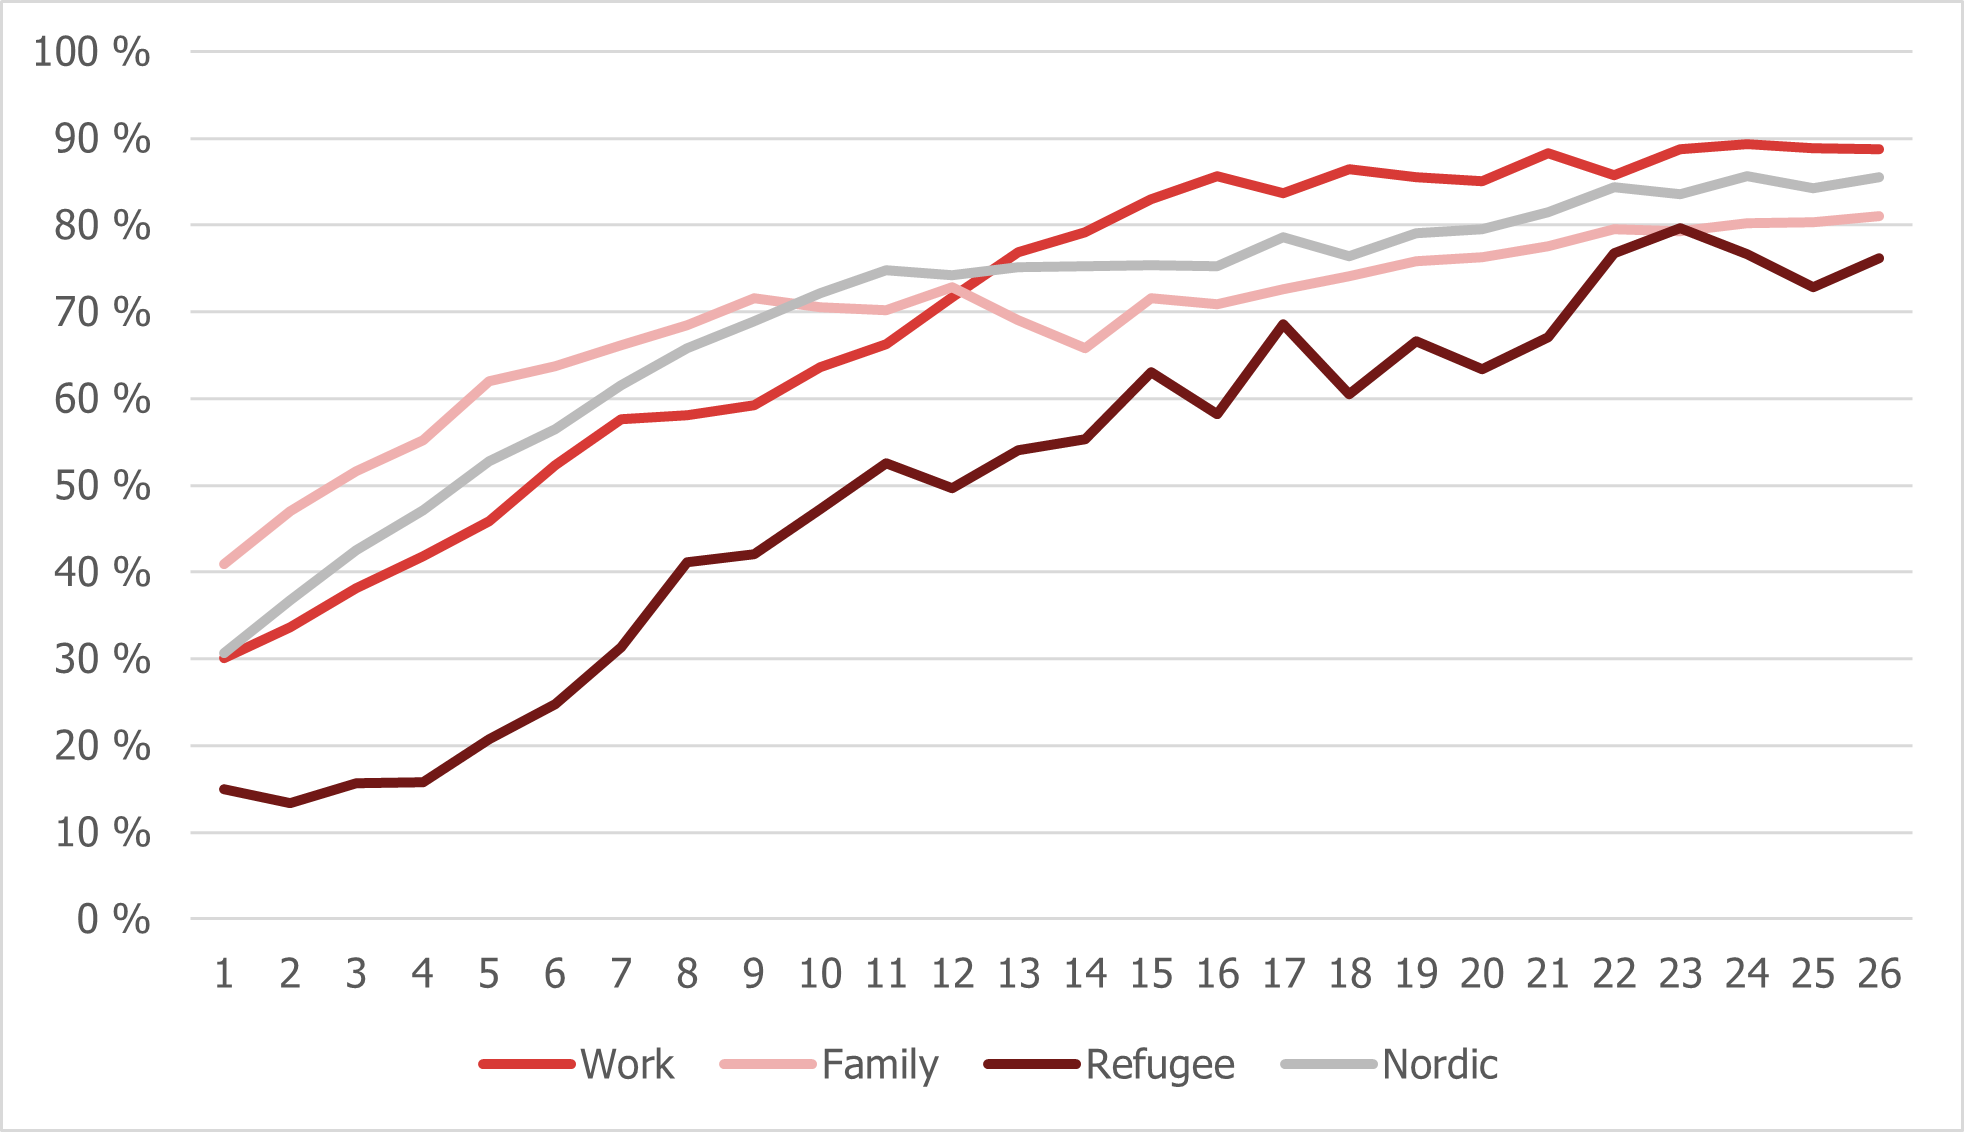
Among refugees with a short period of residence, very few own the property in which they live. This figure varies between 15 and 20 per cent. Among refugees who have lived in Norway for 10 years or more, around half were homeowners, and three-quarters of immigrants who have lived in Norway for 25 years or more owned their own home (Figure 3.9).
Immigrants generally live in more cramped conditions than the rest of the population, but there is large variation in the proportion of people living in cramped conditions between the various different groups of immigrants (Arnesen, 2020). Among refugees and reunified family members, 31 and 30 per cent, respectively, live in cramped conditions, compared with 18 per cent for labour immigrants. Some 11 per cent of immigrants from the Nordic region live in cramped conditions. This is very close to the proportion among non-immigrants, where 8 per cent live in cramped conditions .
The differences in cramped living described above are also found after equivalising for the number of people in the household and the fact that immigrants tend to live more centrally than the rest of the population.